03 Jun Diagnose Google Ads’ Performance Changes Faster With Explanations via @SusanEDub
Anyone who has run Google Ads for awhile has experienced logging in and noticing a decline in conversions, impressions, or click volume.
This immediately sets off a hunt for what’s causing it, which can be time-consuming to diagnose.
Common causes can be things like broken tracking, a new landing page that’s under-performing, changing bids, adding new terms, a delay in reporting, or myriad other issues discovered during troubleshooting once the issue is noticed.
Google Ads has announced a beta for a tool called Explanations to help speed up the process of diagnosing these changes. They are promoting it as a way to find issues faster, and cut down on the time spend digging through reports, tools, and data to locate whether there’s an issue.
Available Campaign Types and Metrics
It will only be available for Search campaigns using manual bidding or enhanced CPC.
It will NOT be available for Display, Video, Shopping, auto-bid setups, or Dynamic Search Ads.
It supports data for impressions, clicks, costs and conversions, with data only available for up to a 90-day window. The changes themselves can still be viewed in a longer time window, but Explanations will not activate.
How to Access Explanations
The function is tucked a few levels down in the reporting mechanisms of Google Ads, as opposed to being prominently displayed.
You must choose a search campaign (see above note on eligible campaign types), and then either a campaign or ad group first.
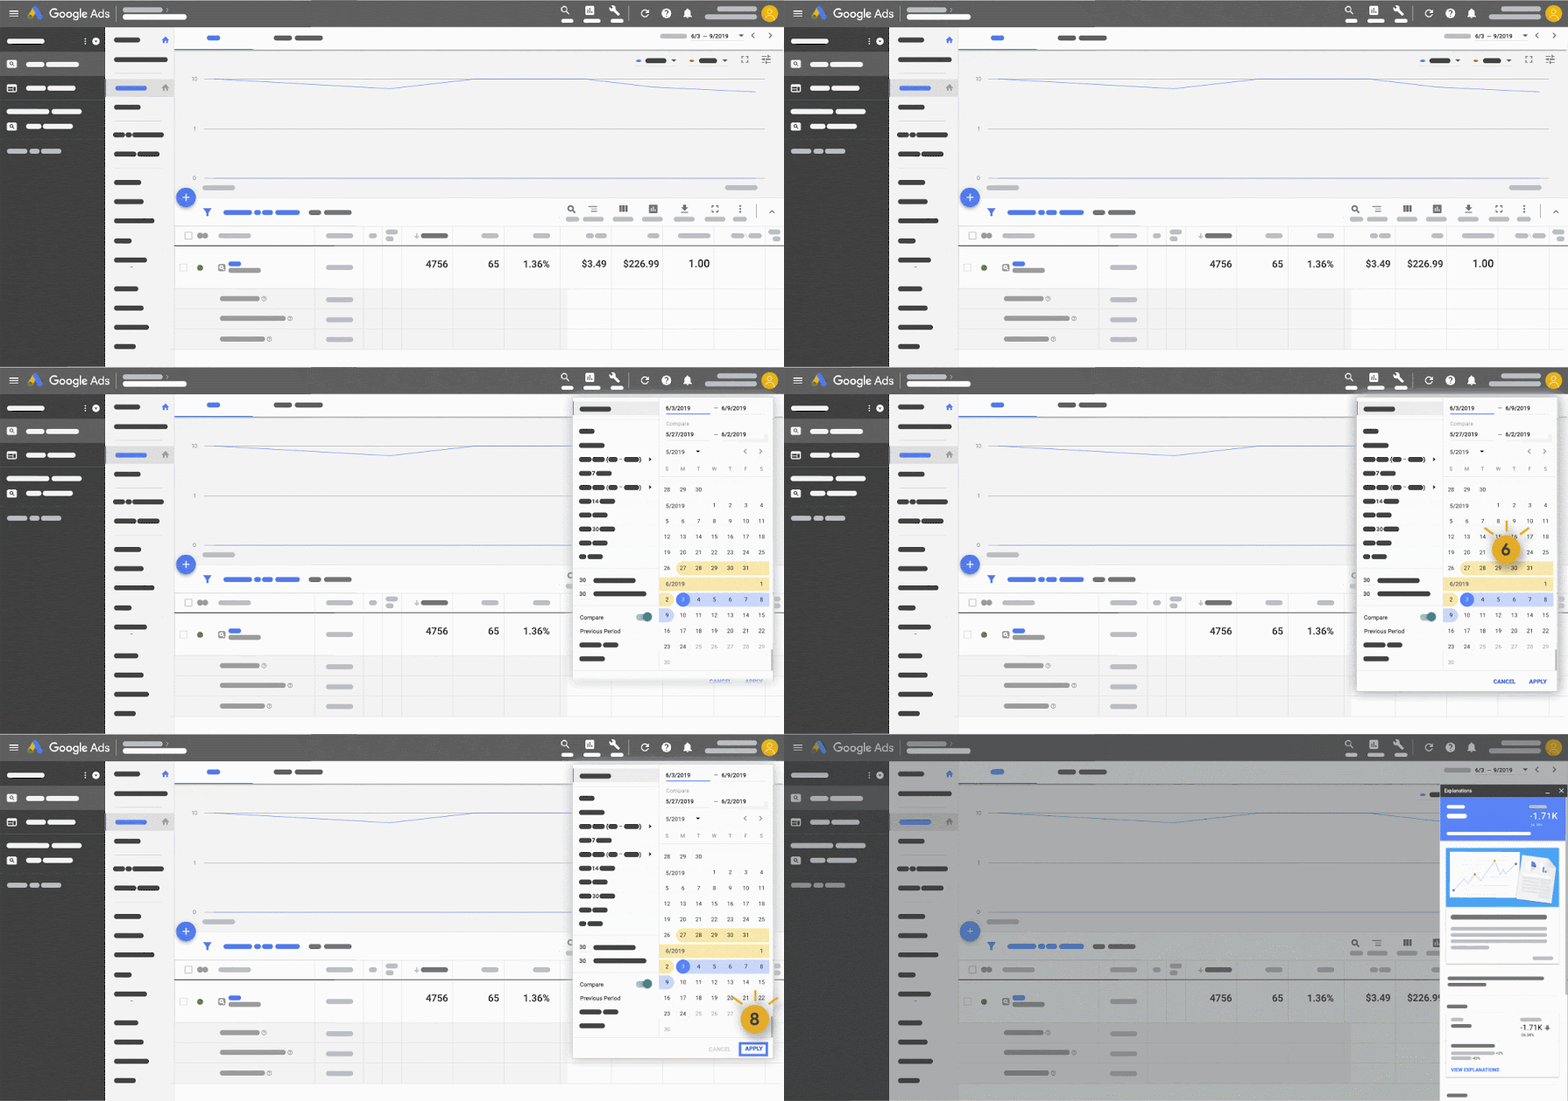
Then you choose your date range in the upper right, and you must activate the “compare to” function for a comparison date range. Note that the time periods must be equal lengths of time for Explanations to be available, and they must be of adjacent times.
So, for example, you can’t view the first week of one month versus the first week of the previous month.
You’ll see the column for each metric you’re viewing with the percentage change as it always has displayed, but significant changes will now be highlighted in blue, like this:
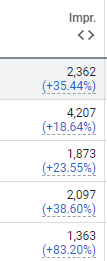

This is triggered by an internally calculated threshold of volume and change to meet criteria.
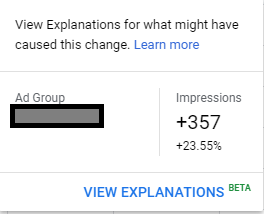
Clicking on the blue percentage change will open a pop up with a call out of the change, and the option to “View Explanations”:

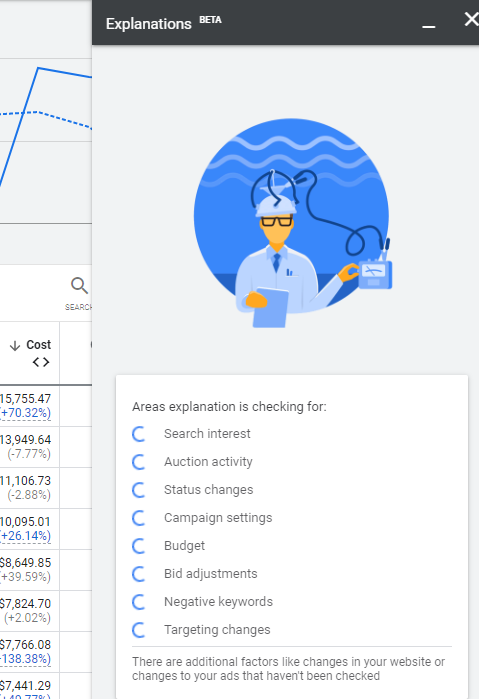
Clicking on it will open the Explanations panel on the right hand side of the screen. It displayed a load screen as it scanned possible reasons for the impression increase:

It then provides the explanation, with relevant data to support its finding:
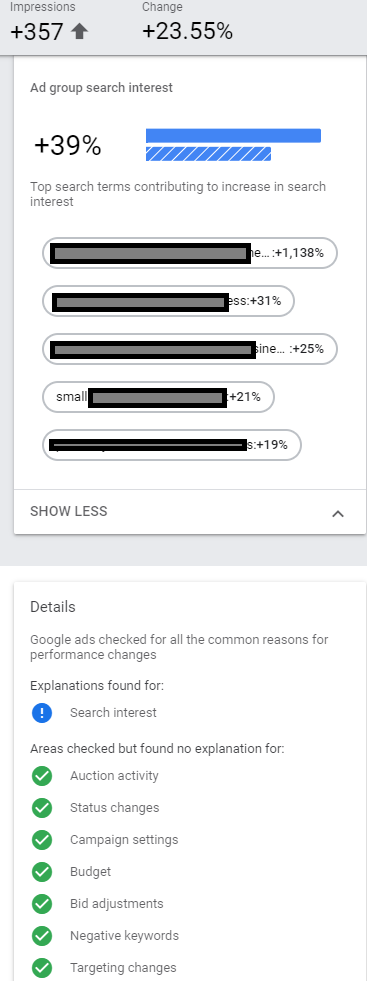

In this example, it was due to an increase in searches, and it notes the specific terms where the increase occurred.
Here is an animation of the entire process to access Explanations from the time you log into your account:

Types of Explanations
Google notes the following types of explanations are what may show in the Explanations pane should you experience a significant change:
- Bid changes
- Bid Modifier changes: How changes to things like device, location, demographic, and audience bid modifier may have affected performance.
- Budget changes
- Budget allocation: Spreading your budget across multiple entities may have affected the performance, such as adding new ad groups that are now sharing a budget with something that previously had steadier performance.
- Budget exhaustion rate: If changing your CPC is causing you to run out of budget
- Conversions: If you changed conversion actions to count or not count in your calculations, or if settings may have affected the totals. It will also include data on conversion lag and tag firing frequency.
- Eligibility: Whether different factors may have affected how often your ads were eligible to be shown.
- Targeting changes
- Auction competitions and search interest
- Change history: How other changes to your account may have affected your account’s performance.
Google’s announcement can be found here, with further documentation here.
Sorry, the comment form is closed at this time.