04 Feb How the Facebook & Instagram Divergence Impacts Your Media Spend via @SusanEDub
Nowadays, a marketer will tell you the user demographics for Facebook and Instagram aren’t the same.
Despite being managed within the same ad manager interface, the reality is that these two avenues are starting to have less in common.
On the surface, it’s usually a tale of “Instagram skews younger.” That’s certainly true, but it’s interesting (and important!) to note that there are also vastly different goals for users on these platforms.
These differences are key in how results play out in advertising on the platforms.
In the past, Instagram was a placement box that was checked, and little further thought was given to it. The inventory was smaller, so fussing with it didn’t necessarily result in more value; it was just gravy if it worked.
Now? We are seeing vastly different performances in the two channels, not only in age but also in ad formats.
What does all this mean for advertisers?
Let’s take a look at both what we know about the users in each platform, and then a case study of how we see these truths manifest.
Age Distribution Between the Platforms
Now, these graphs look slightly different because one contains gender and one doesn’t. However, the takeaway here is very clear.
First, here is the user distribution by age for Instagram worldwide, as of October 19, 2019.


In other words, out of all their users, 71.2% are under the age of 34.
Now let’s look at Facebook. (These numbers vary a bit because they’re split by age.)


Even if we take the best case scenario of the male percentages, their distribution for the 34 and under set amounts to just 37.2%.
No doubt: the talk about Instagram largely being younger is true.
Reasons for Usage Between the Two
Let’s go beyond that for a minute, since to many this seems like common knowledge. There are interesting differences in the motivations behind why users are on these platforms.
First, let’s stick with Instagram and look at the usage reasoning there:


As with many social networks, there’s a large friends/family component.
The part to pay attention to is after that:
- 47% follow for entertainment.
- 34% do it to follow brands and companies.
This is especially interesting, because it highlights the way in which Instagram ads can be most effective, and possibly even a better return: users are expecting to hear from brands, and they want to be entertained by it.
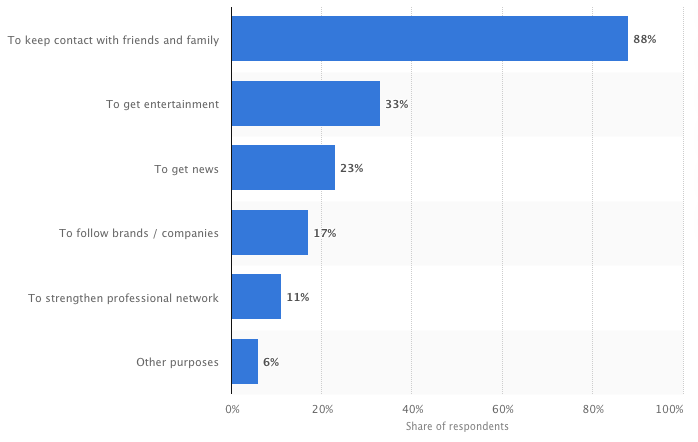
Juxtapose that with usage reasons for Facebook:


Yikes!
They really just want to keep up with friends and family, and maybe have some entertainment. They aren’t about your brand.
How Does This Work Functionally in Ads?
This dynamic started to play out across accounts of all types last year.
There were general complaints of longer sales cycles, less user engagement, and generally lower ROAS for Facebook from marketers and brands.
Many advertisers didn’t address Instagram separately in those conversations, but they’re a worthy discussion. This is especially coming true with the advent of new ad units, and how Facebook is choosing to distribute them.
There were two major additions to the Instagram platform that subsequently rolled out to Facebook:
- Story Ads.
- Polls.
The success of Story usage organically on Instagram is undeniable, and this chart only goes through last year at this time:


Stories were subsequently added to Facebook. Their belief in its growth on the Facebook side was so fierce, their app redesign put Stories as the first row in the experience.
However, anecdotally many advertisers aren’t seeing the traction of ads there like they are in Instagram Stories. The adoption rate was at 300 million last March, still lagging Instagram’s 500 million users.
While a formidable number, this is truly where the difference in why users are on the platforms seems to rear its head, and it combines with the lower distribution in the younger ages to make Facebook Stories a tougher ad landscape than the fertile ground we’re repeatedly finding in Instagram Stories.
A Study in Demographics & Placements for Stories
We have seen the dynamic of Instagram Ads with age demographics play out fairly consistently over the past two years.
But starting last year, we started to see the shift into Stories become apparent. Not just from an inventory and adoption perspective on Instagram, but also in superior ad performance.
The pattern of Stories outperforming Feed has been noticeable on both small and large scale.
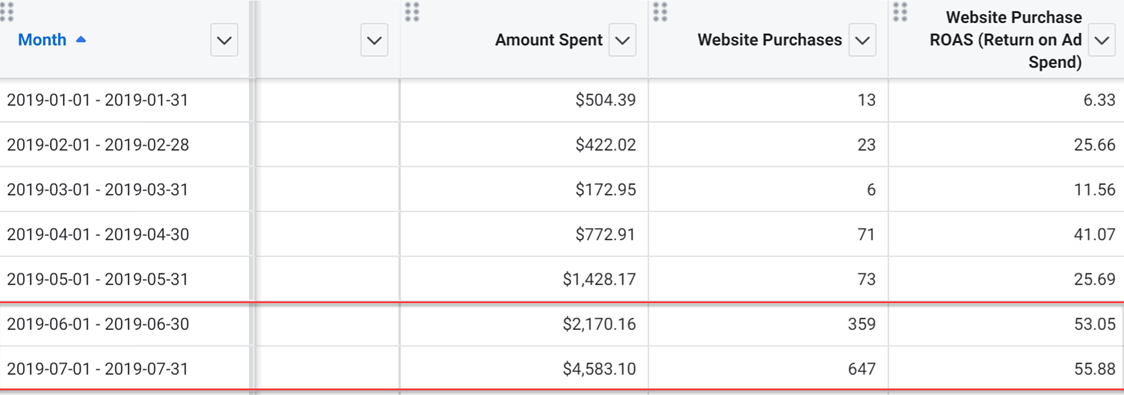
Here is an example from earlier in 2019. This spend took place over a couple of weeks, where we simply had Instagram Stories checked as ad placement.
We designated separate creative for it to maximize the screen experience, but deferred to Facebook on budget allocation:


This became a common occurrence, leading to the next steps on the path:
How much should we focus on a whole separate creative process for Instagram Stories? And then whether we should be allocating budget manually to get as much inventory as possible.
In some cases, we were finding that Stories performed well with the creative, but the budget allocation was scattershot.
Once we took control of assigning budget, we were able to maximize volume more and scale it efficiently:


The key to making this kind of results possible is understanding the two factors outlined at the start of this post:
- It’s a different age skew.
- They want something different from the platform.
Instagram users want and expect to hear from brands, combined with the desire to be entertained.
Story placements achieve these goals in spades.
The full-screen experience is immersive, and interactive elements like polls are there specifically to draw users in for engagement.
Spending at Scale: What Facebook Story Ads Do
This obviously brings up the question of Facebook Story Ads.
Understandably, Facebook is focused on these being adopted as a large part of user interaction on the platform.
Unfortunately, getting traction on them has been more difficult.
In almost every case, we encounter low inventory, low engagement, and low (or no) conversion volume.
Your mileage may vary, but when compared to Instagram Story Ads, they aren’t in the same league.
We recently put this to the test in a large ad buy over the holidays. The buy was focused on app installs, specifically to try and conquest against a main competitor.
When the results were in, we rolled up Feed vs. Story performance, and the difference was marked.
Spend allocation
- Facebook Stories: $6,706
- Feeds: $601,102
- Instagram Stories: $145,367
CPMs
- Facebook Stories: $16.63
- Feeds: $15.94
- Instagram Stories: $12.70
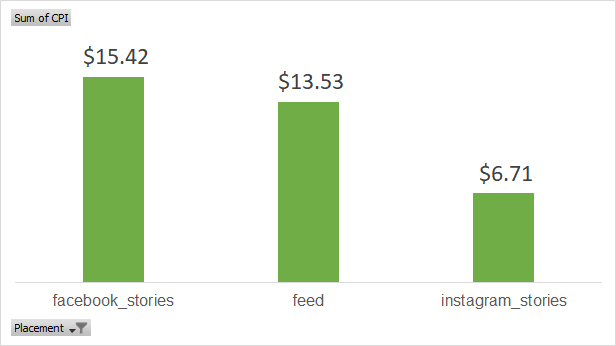
And this was how cost per install shook out across the three:


Though a small part of the buy, Facebook Stories lagged far behind on installs while having the highest CPM.
Feeds were still fairly high on cost, though their volume was much greater, but at the end of the day, Instagram Story Ads continued to win.
What Does This Mean for Advertisers?
No, the feed isn’t dead.
No, it doesn’t mean Facebook Story Ads will never work.
What it means is that user needs and expectations are different. It isn’t just about age groups and where they hang out, it’s also about meeting them at the intersection of their interest and engagement tendencies are.
Facebook is taking cues from Instagram and rolling them out as offerings, but do not expect the same adoption rate.
Just as we will see Instagram’s user base likely trickle into older demographics over time, expect the adoption curve to work the same way on new types of ad units and experiences.
The key will be when that shift happens. The data shows us right now, it’s not happening yet.
As marketers, our job is to watch these shifts happen, because they will be slow.
Story Ad success didn’t happen overnight, but the ones who watched it and saw it happening shifted and merged into that lane quickly.
The bulk of brands still don’t do justice to the ad unit and assume they don’t work. These are the golden times to capitalize on them as a brand because competition is far behind where you can be.
On the other hand, understand ad success on one platform doesn’t beget automatic success on the other. The time has come to treat these as the two different ad platforms they are.
Instagram is no longer just a checkbox within Facebook’s ad interface, and it shouldn’t be that way in your marketing plan, either.
More Resources:
- 13 Facebook Ads Features Every Marketer Should Know
- 7 Unexpected Tips That Will Make Your Facebook Ads More Effective
- 4 Strategies to Increase Facebook Lead Ad Quality
Image Credits
In-Post Statistics Graphs: Statista
Data and case study screenshots: Taken by author, January 2020
Sorry, the comment form is closed at this time.