08 Apr How to Use Google Search Console for SEO: A Complete Guide via @sejournal, @annaleacrowe
What reports do you look at in Google Search Console?
Is it the links to your site?
Do you check crawl errors to see if you need to implement any 301 redirects?
Are you looking to adjust your URL parameters at all?
You can use Google Search Console for pretty much everything.
Originally known as Google Webmaster Tools for nearly a decade, Google rebranded its suite of tools as Google Search Console in 2015.
With every new year, Google has given us new tools, analytics, and data to track in Google Search Console.
In this column, you’ll find a complete breakdown of the basics. From URL Inspection Tool to the Coverage report, you’ll be giving your SEO reports a mini upgrade on the regular.
Plus, I share my monthly SEO health checklist.
Overview Report
What is the Overview Report in Google Search Console?
The overview report in Google Search Console featured three main reports:
- Performance.
- Coverage.
- Enhancements.
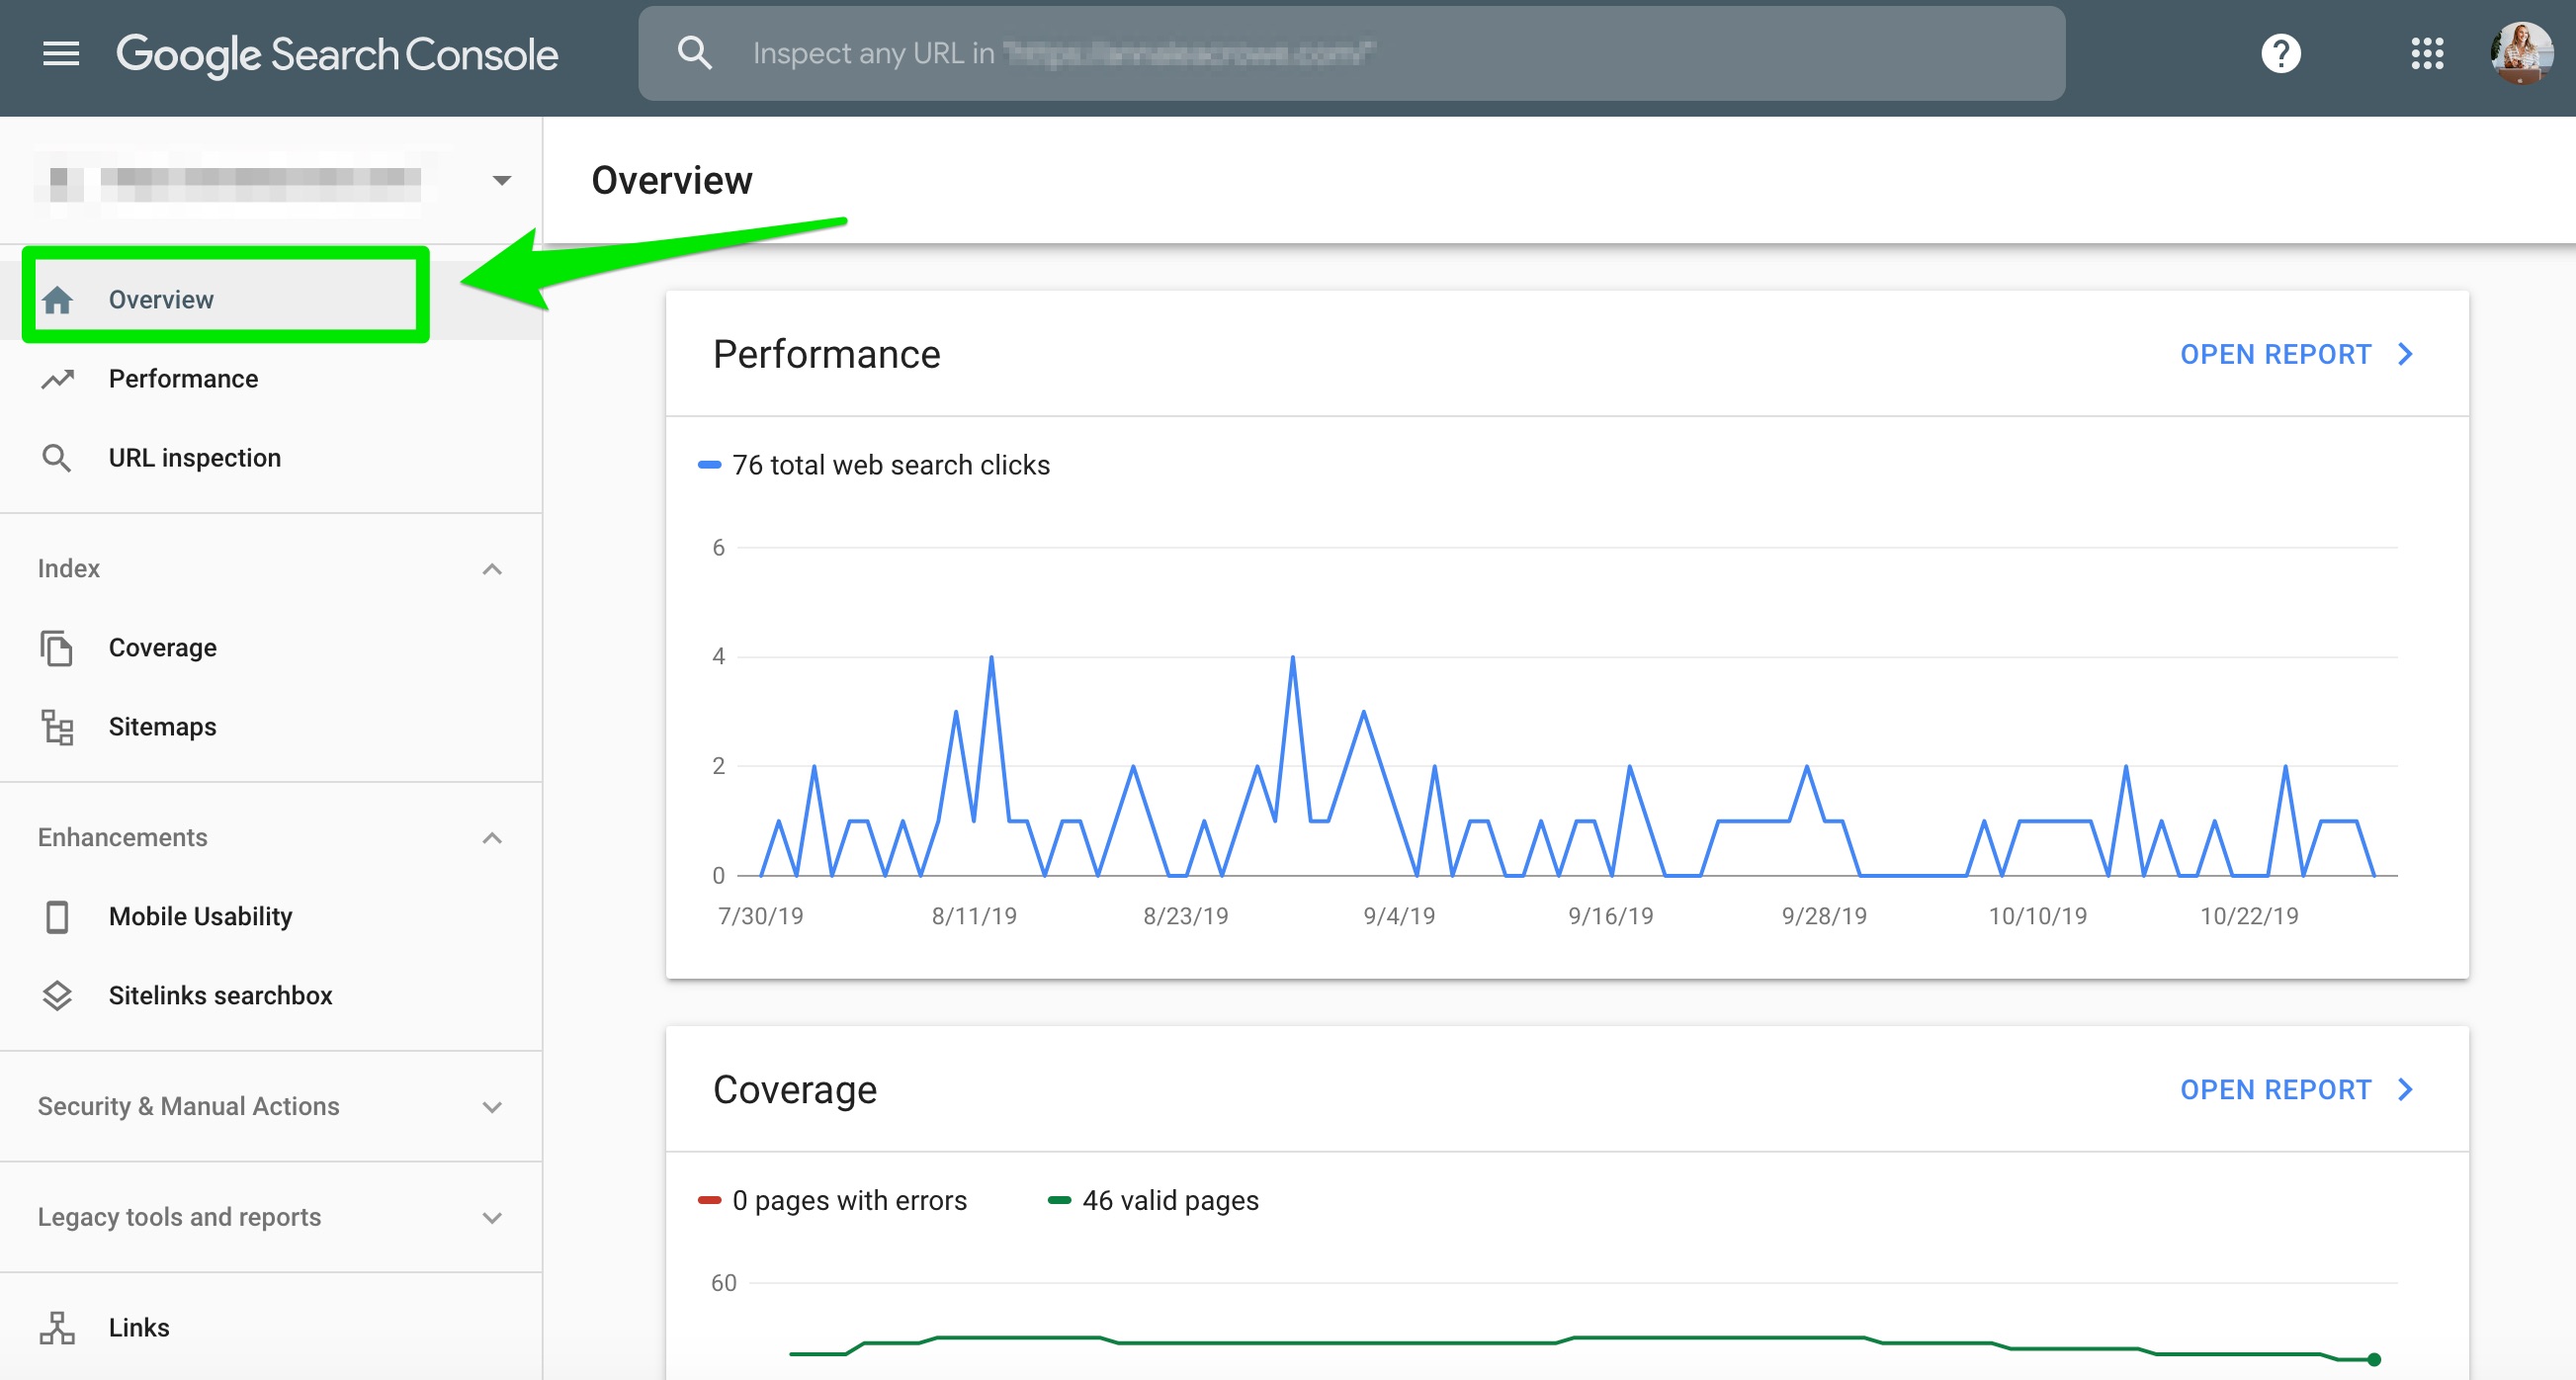

We’ll dive deeper into each of these reports later.
URL Inspection Tool
What is the URL Inspection Tool?
The URL Inspection tool might be one of my favorites because you get to see how Google views your website. This tool allows you to test how Google renders your site.
If you published a new blog post or redesigned a webpage, you can use this URL inspection tool to submit the URL to signal to Google to crawl that page.
It’s similar to the Fetch as Google tool in the old GSC.
How to Use the URL Inspection Tool
To use the URL Inspection tool, add your URL to the top search bar in Google Search Console here:


Then, you should see a report like this:
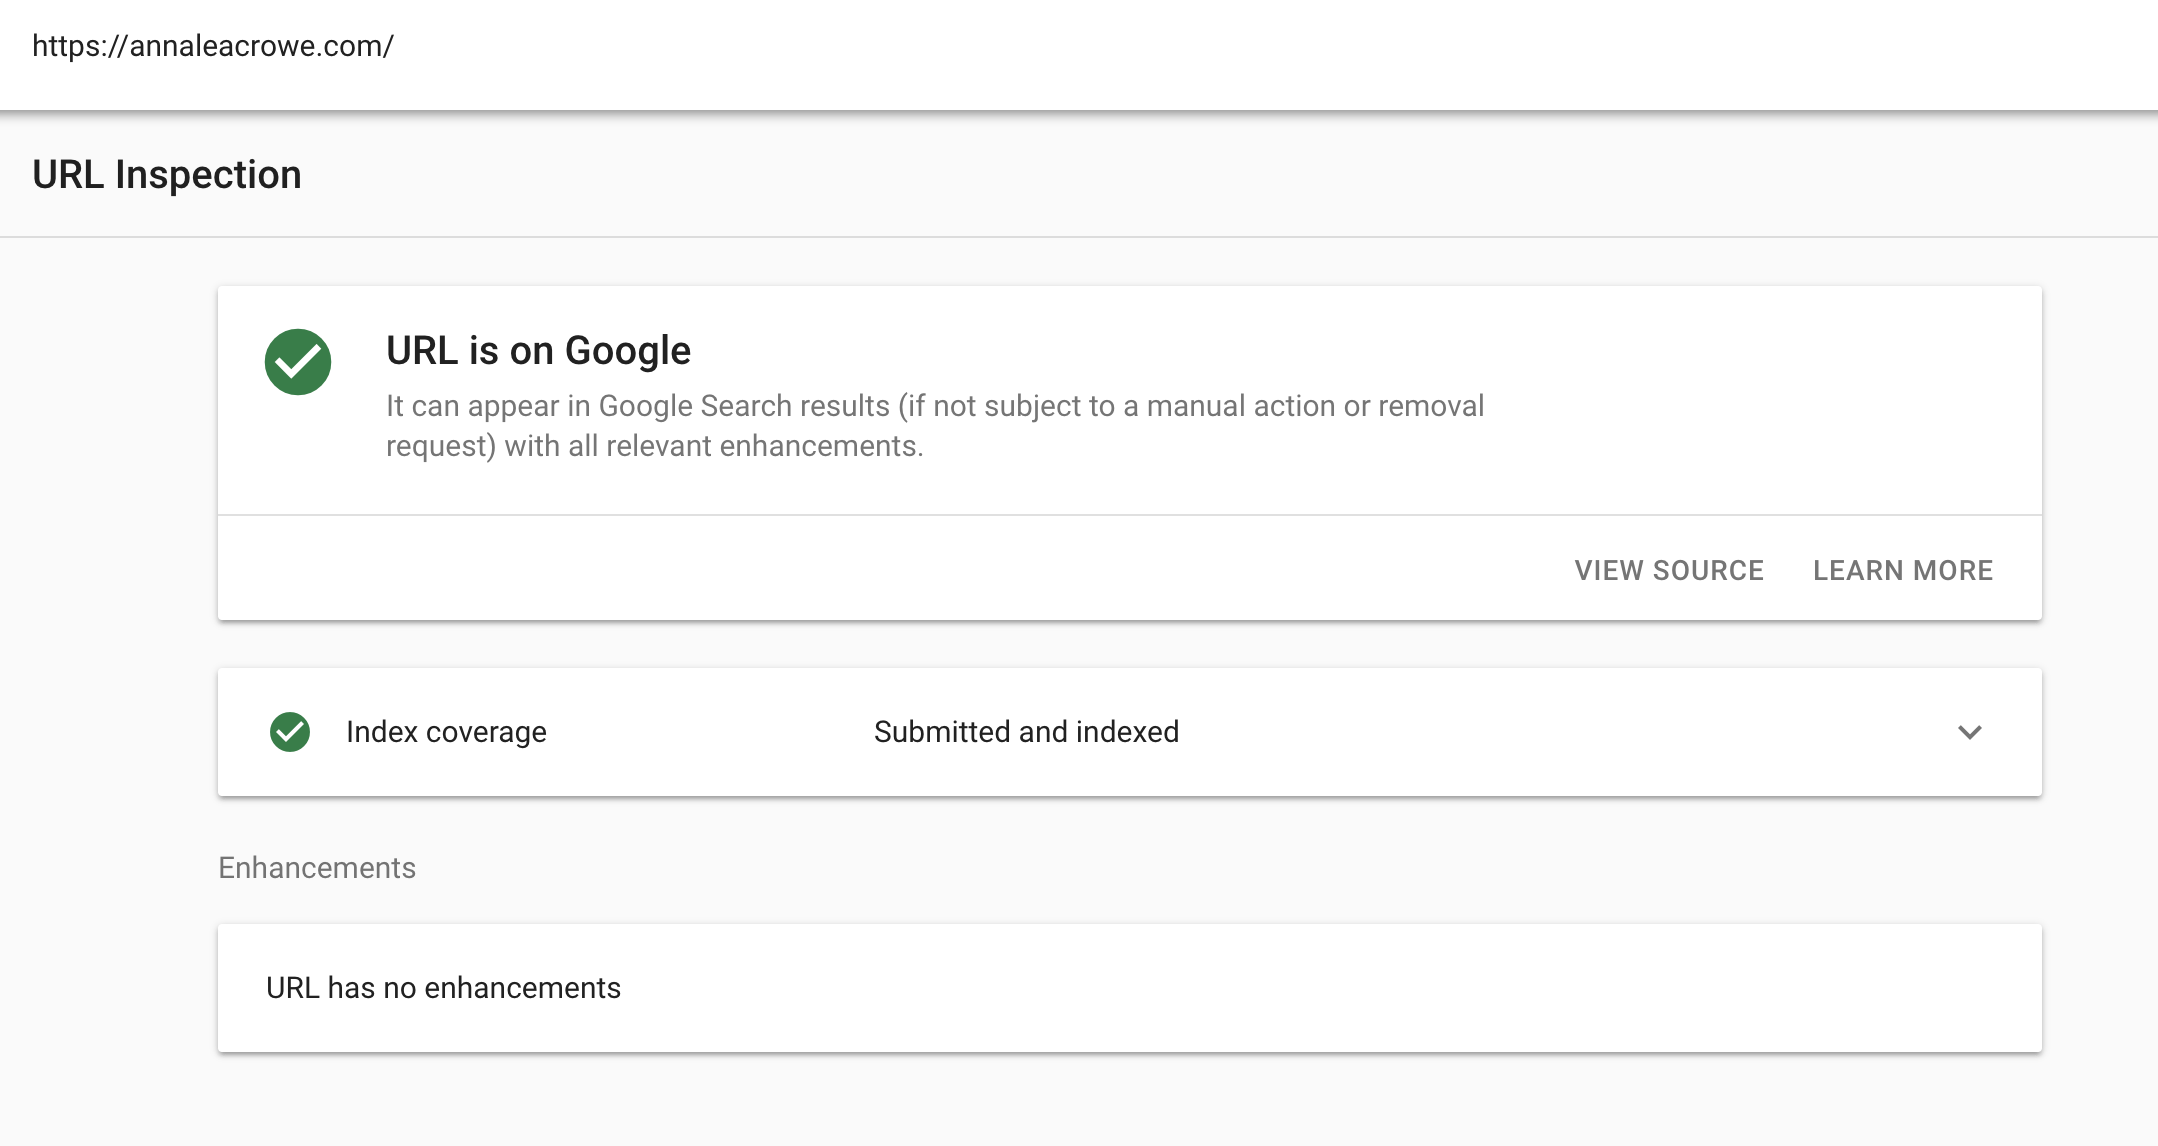

Google released a list of features for this tool that you can read about here.
I often use the URL Inspection Tool to understand more how Google is crawling my site.
For example, you can see when Google last crawled your webpage which can help dissect fluctuations in the SERPs.
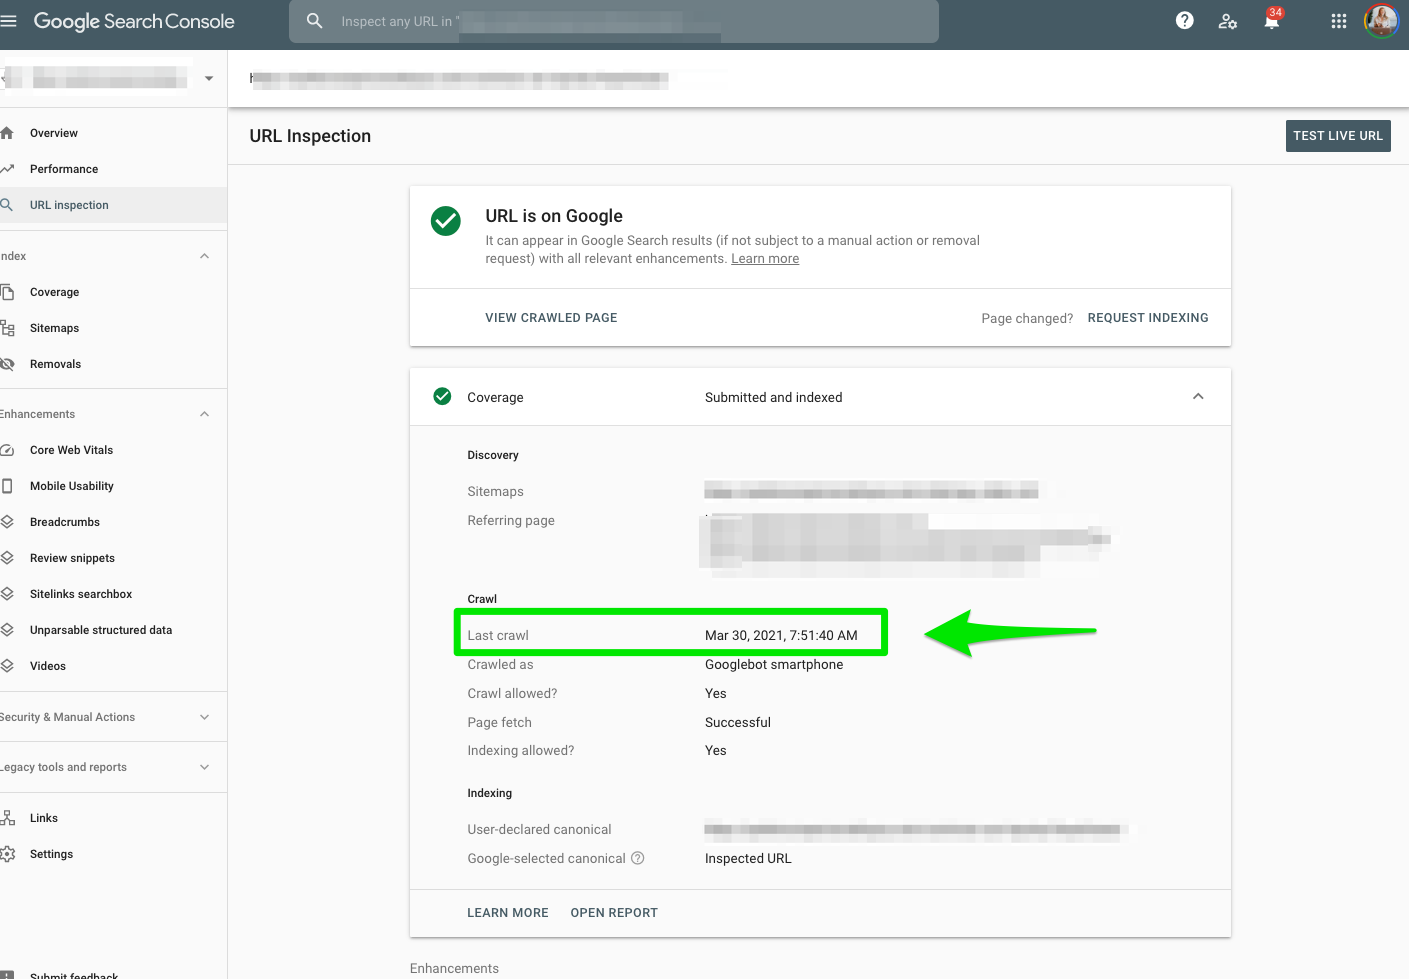

Other uses for URL Inspection Tool :
- Update an old webpage.
- Launch a new section of your website.
- Introduce a new mobile design.
- Updated robots.txt file.
- Implemented rel=canonical tags.
- The transition from HTTP to HTTPS.
Performance
Search Results
What is the Search Results Report in Google Search Console?
You’ll see the Search Results under the Performance section.
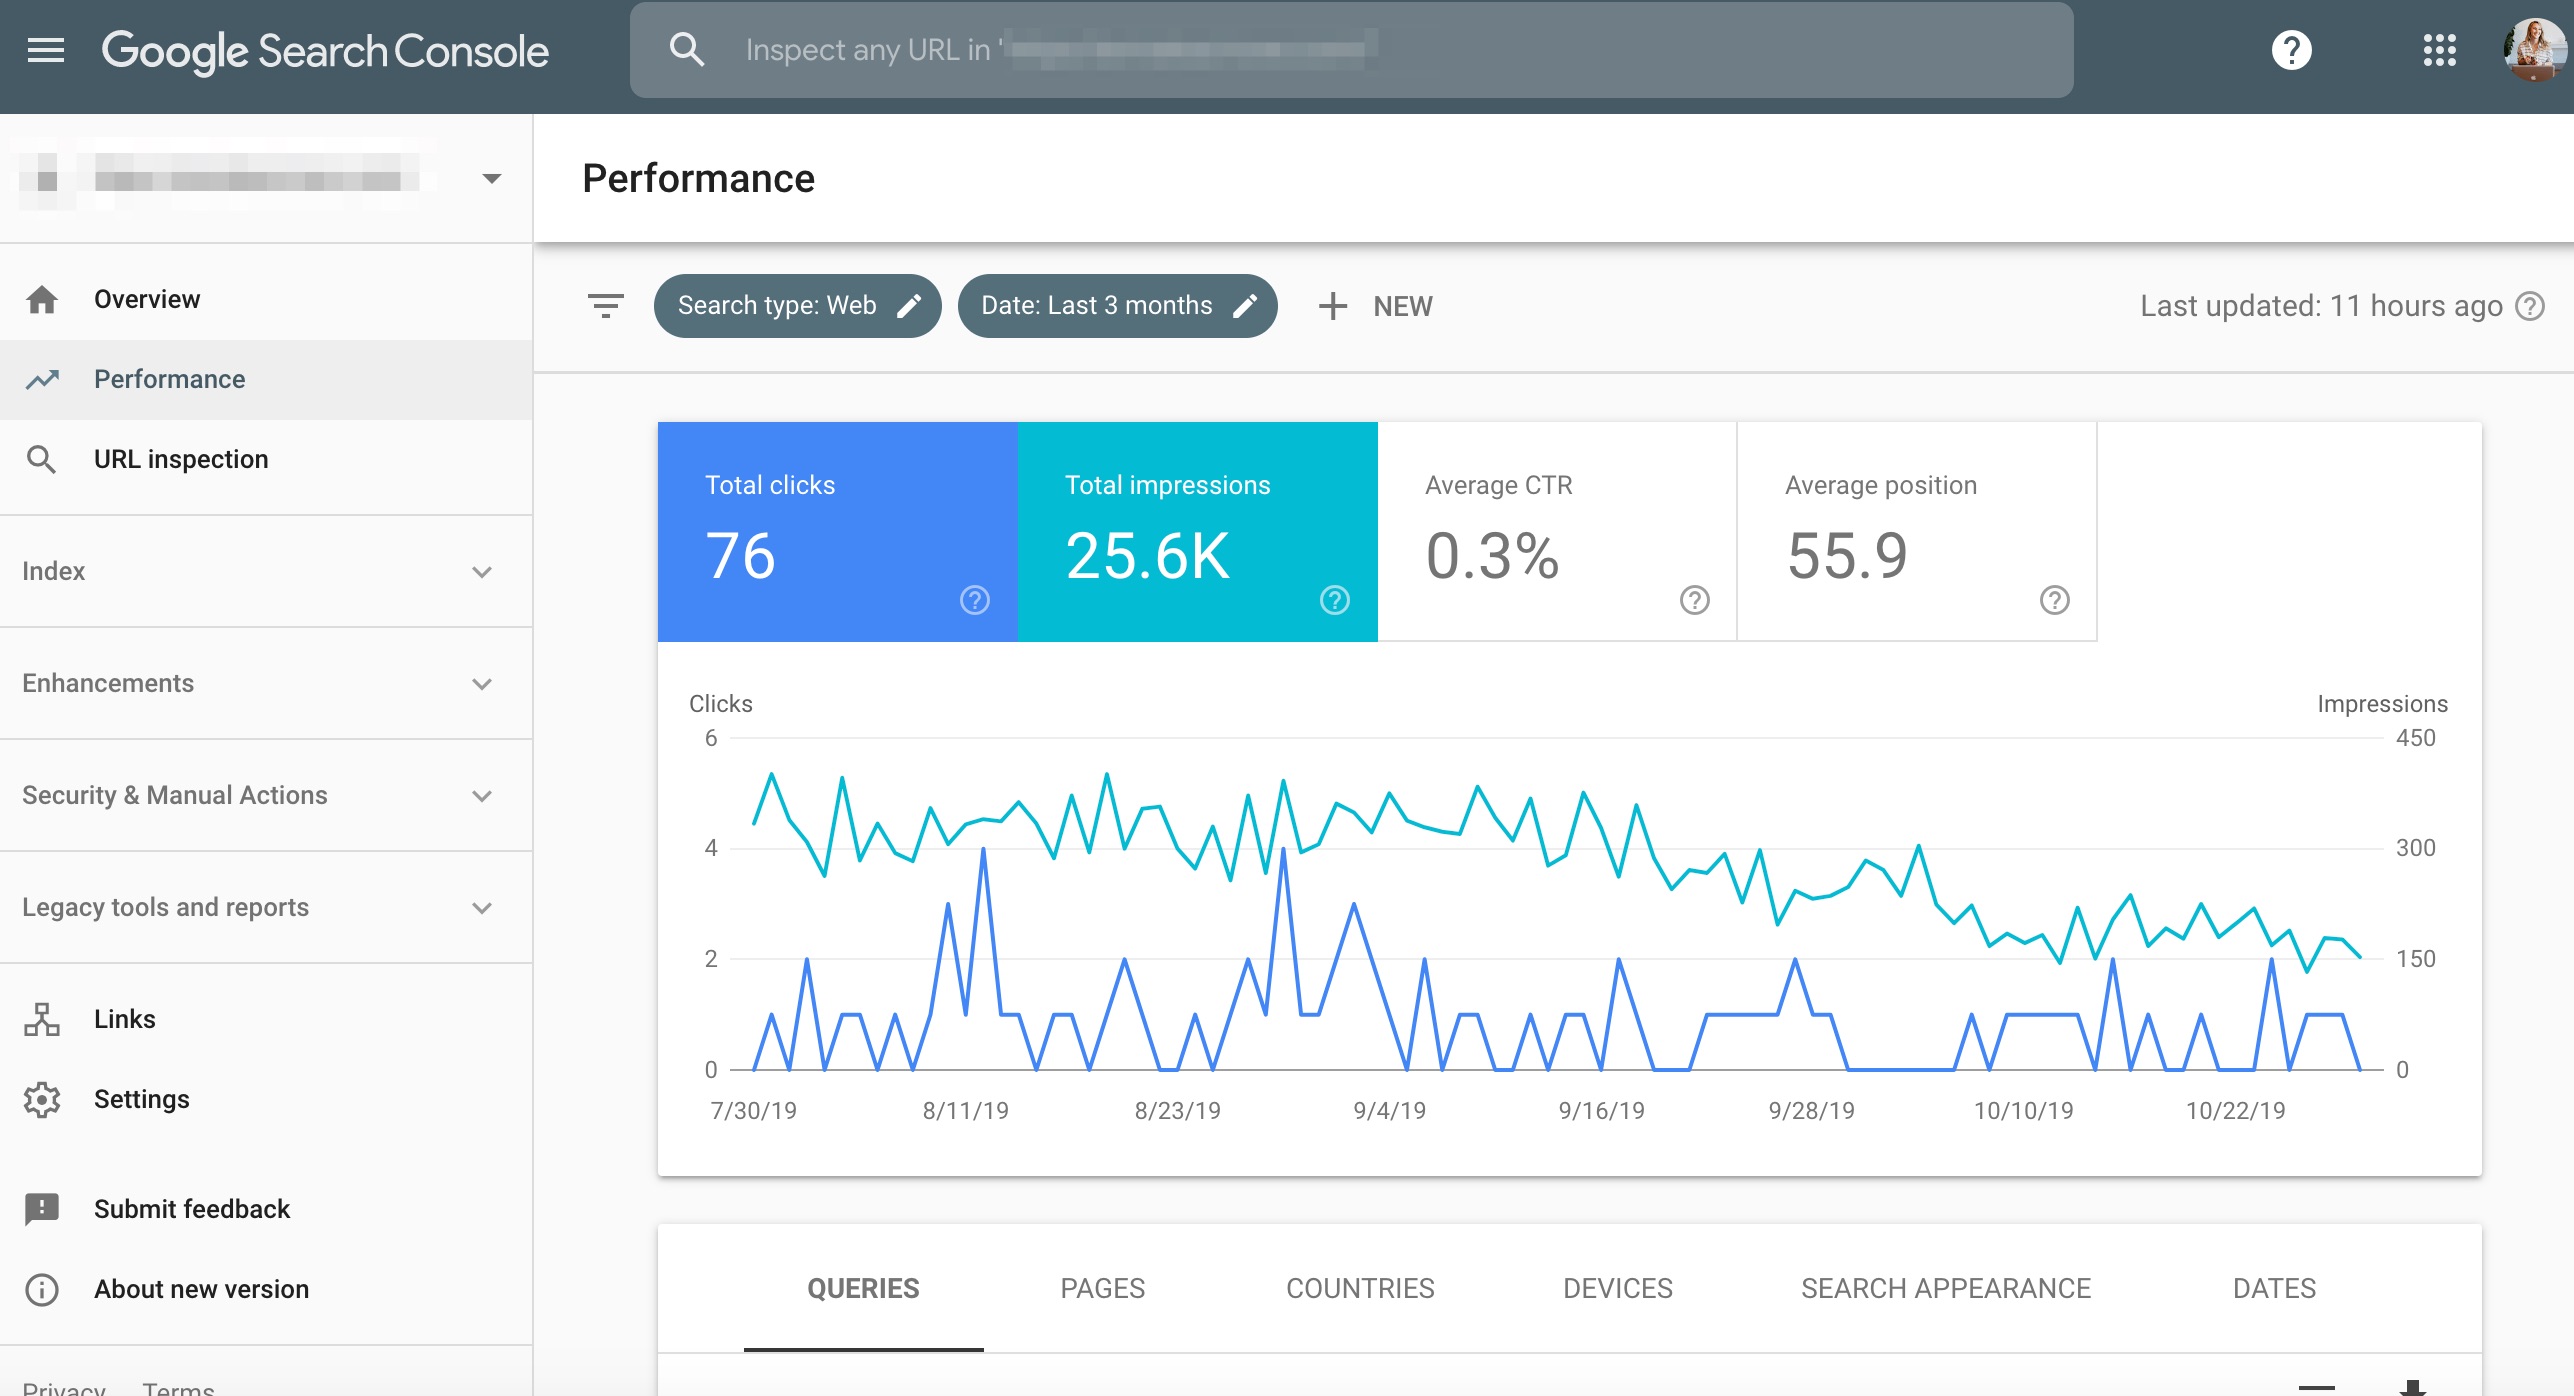

You will have the same metrics available, but you’ll have 16-months worth of data. Plus, you’ll the ability to filter results by:
- Job posting.
- Rich results.
- AMP pages.
- Non-rich AMP results.
- News.
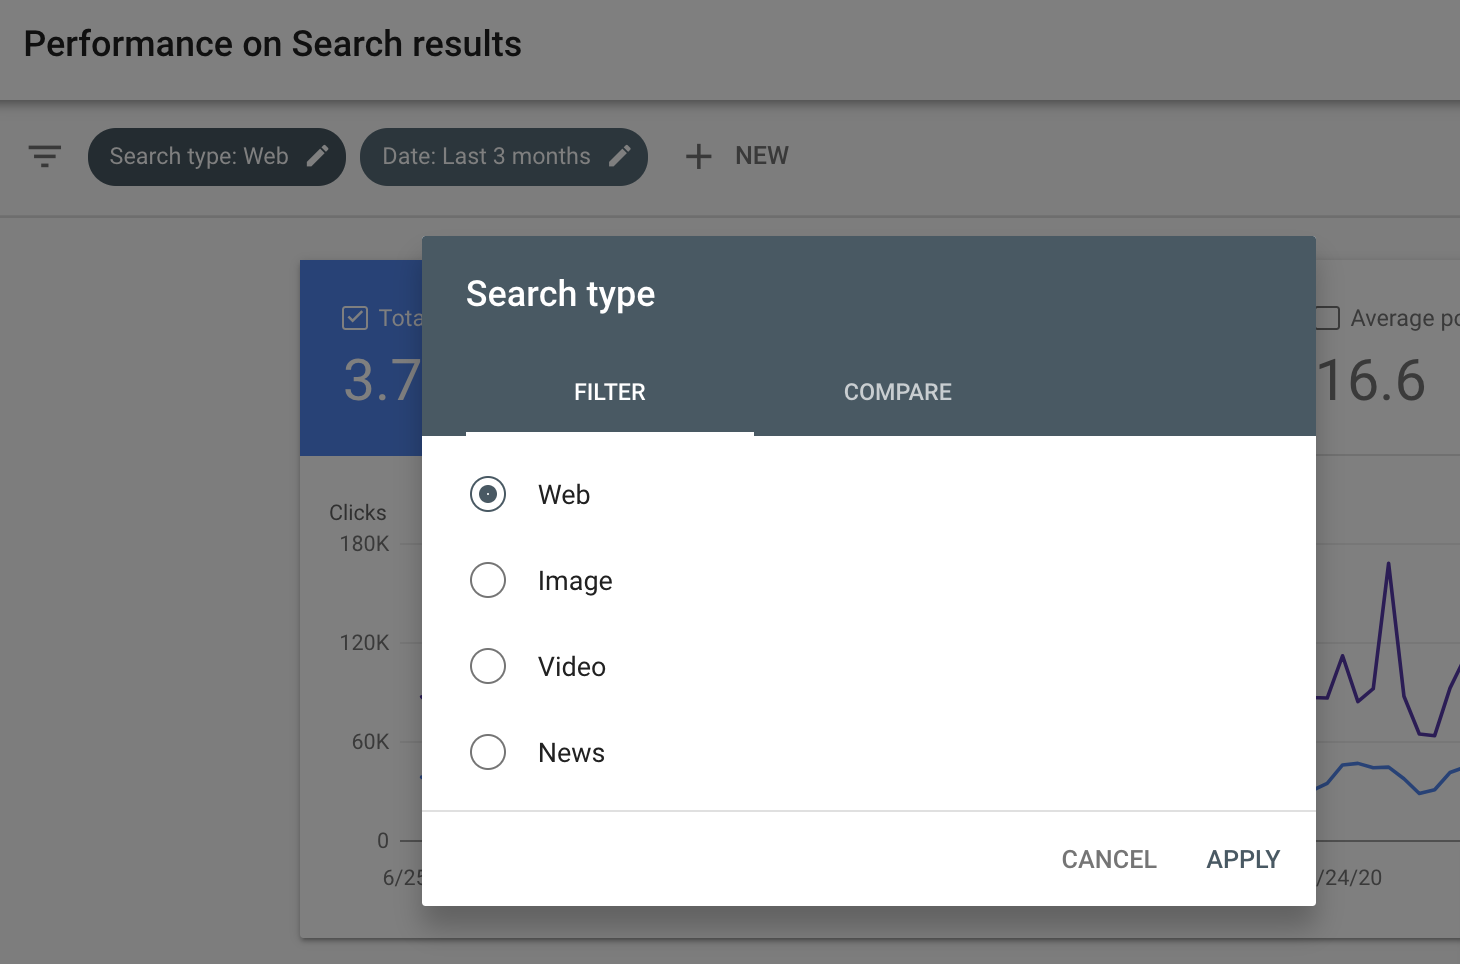

Google is continuing to add more search filters. I’ll update this article with more features as they are added.
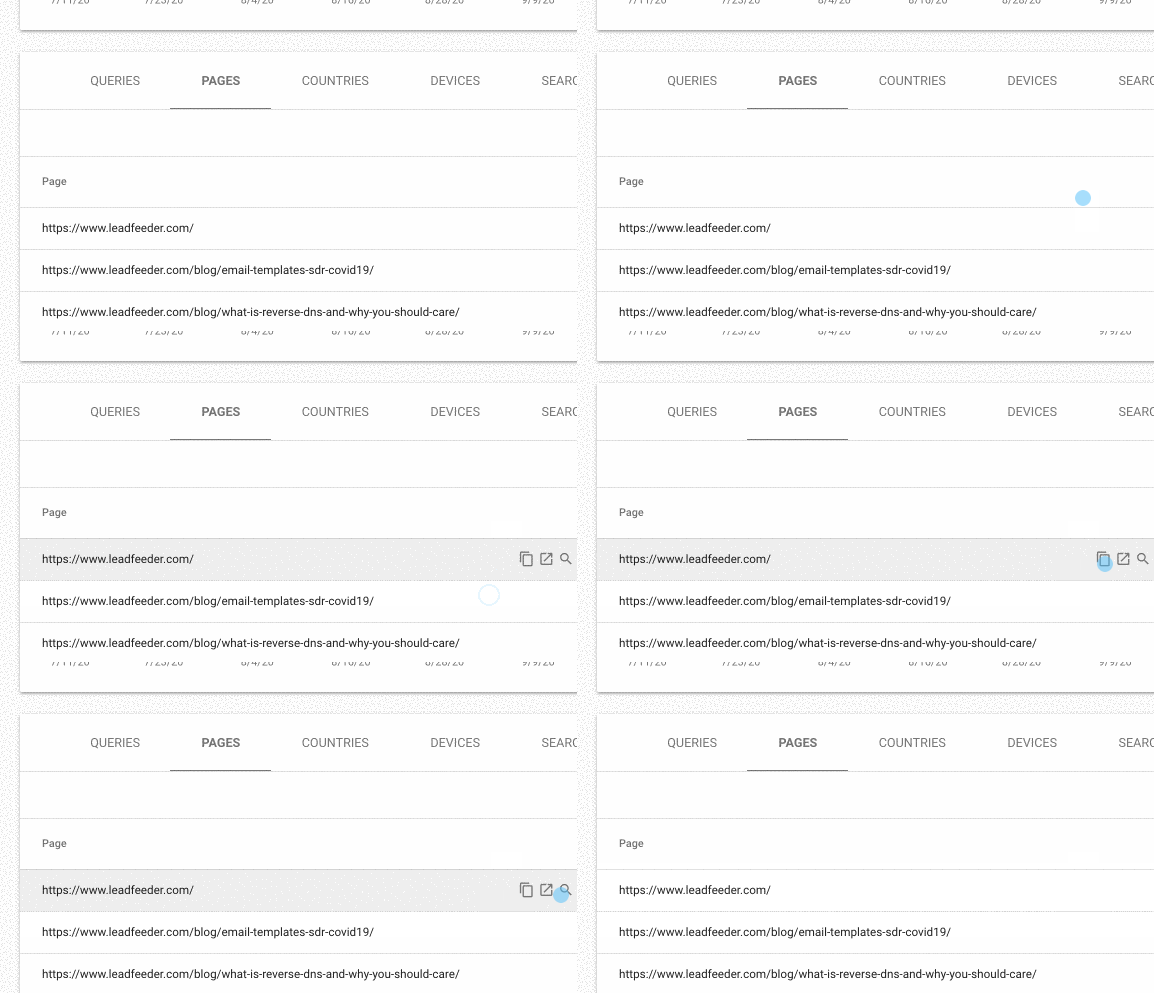
Google also released a productivity feature that allows you to copy, open in a new tab, or inspect a URL when viewing this report.

If you’re like me and your spreadsheets are filled with traffic and keyword positioning changes, then Search Performance is the ranch dip to your carrot. 🥕
If not for the content opportunities (what editorial calendar dreams are made of) then, at least, for the impressions and clicks data by country and device.
What Reports Can You Build With the Search Results Report in Google Search Console?
The 16-month data is an excellent way to get a quick overview of your website and content performance in the SERPs.
If you’re building spreadsheets, try this. Trust me; it’s a major time-saver.
Here’s an example of a spreadsheet I’m able to build:
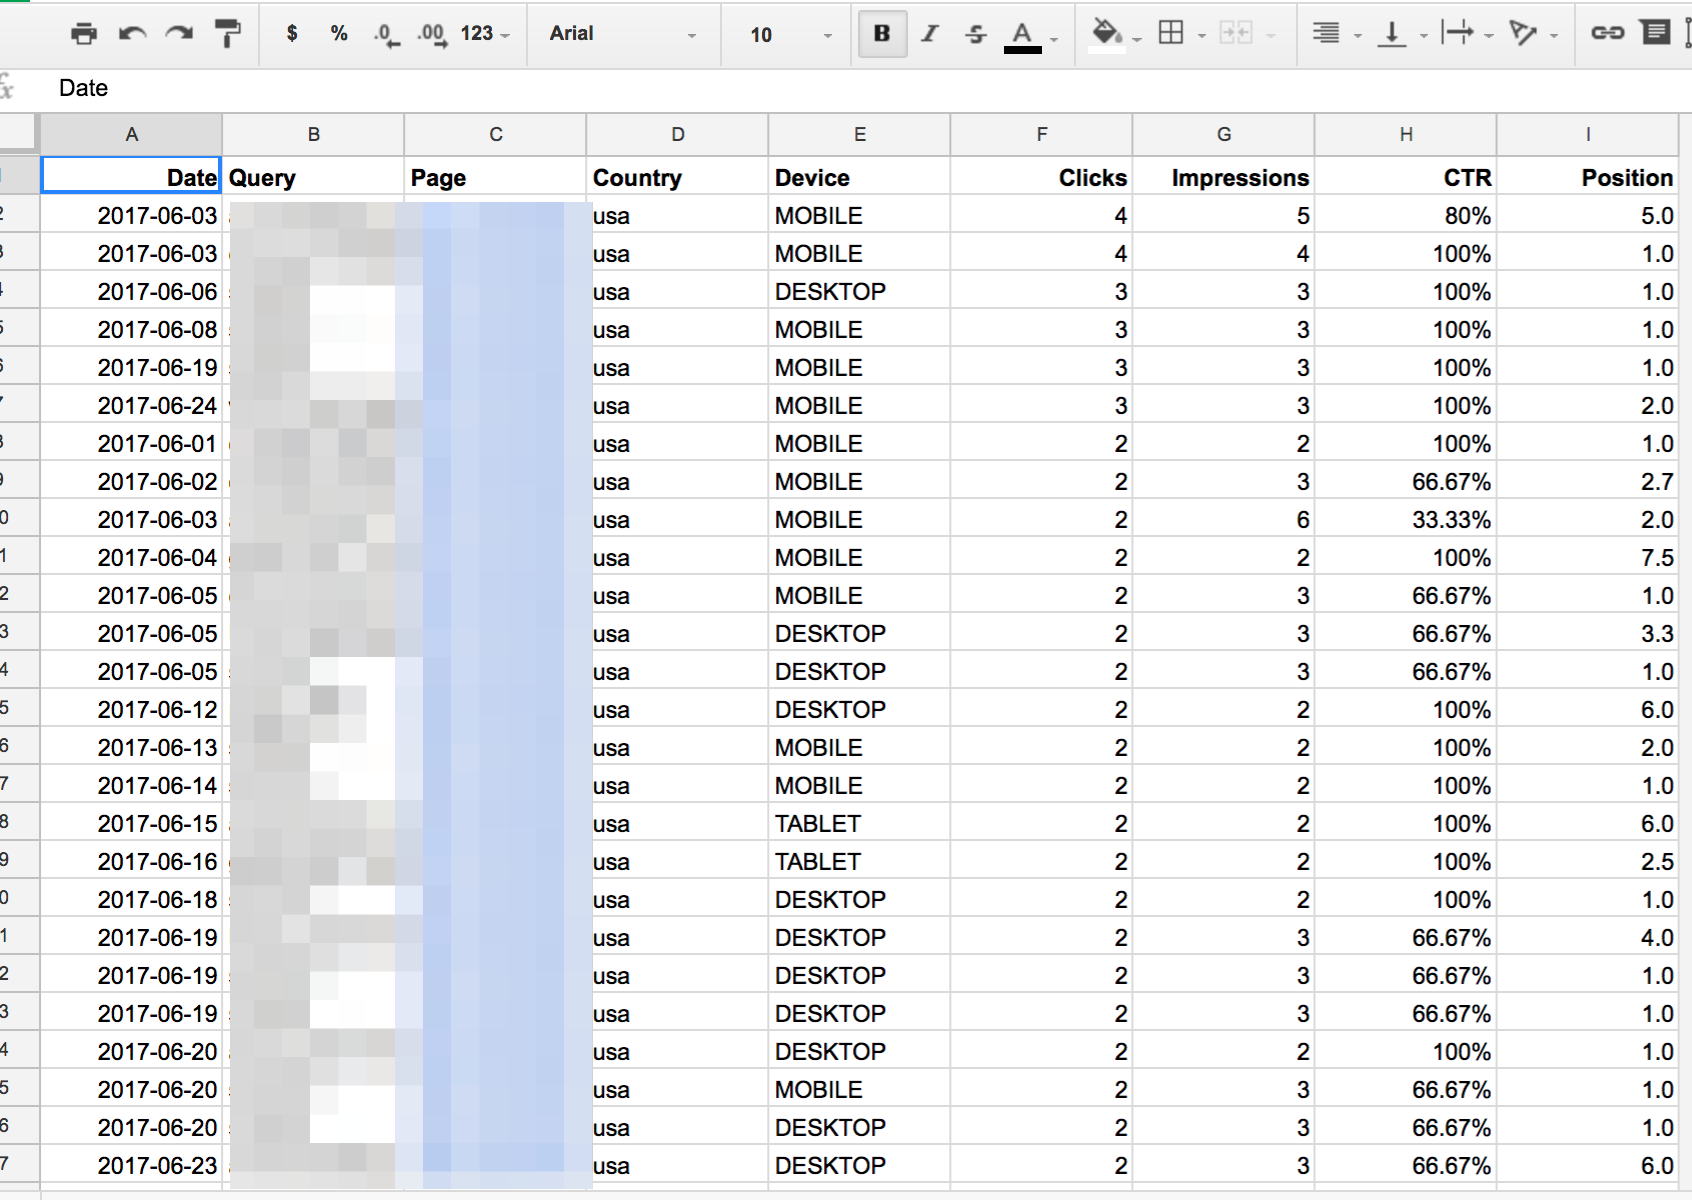

You can use this data to identify:
- Top-performing pages.
- Pages with low CTR.
- The number of clicks per keyword.
- The number of impressions per keyword.
For example, I use this data to determine what metadata I need to rewrite.
If I have a page with high impressions and low clicks, this may mean my title or meta description needs to be improved.


You can also use this part of Google Search Console to dive deeper into keyword research.
If you are pulling data for keyword research, you can filter a query or page filter using regex (regular expression).
For example, if your company sells burritos, you can filter by “burritos” in the queries report.
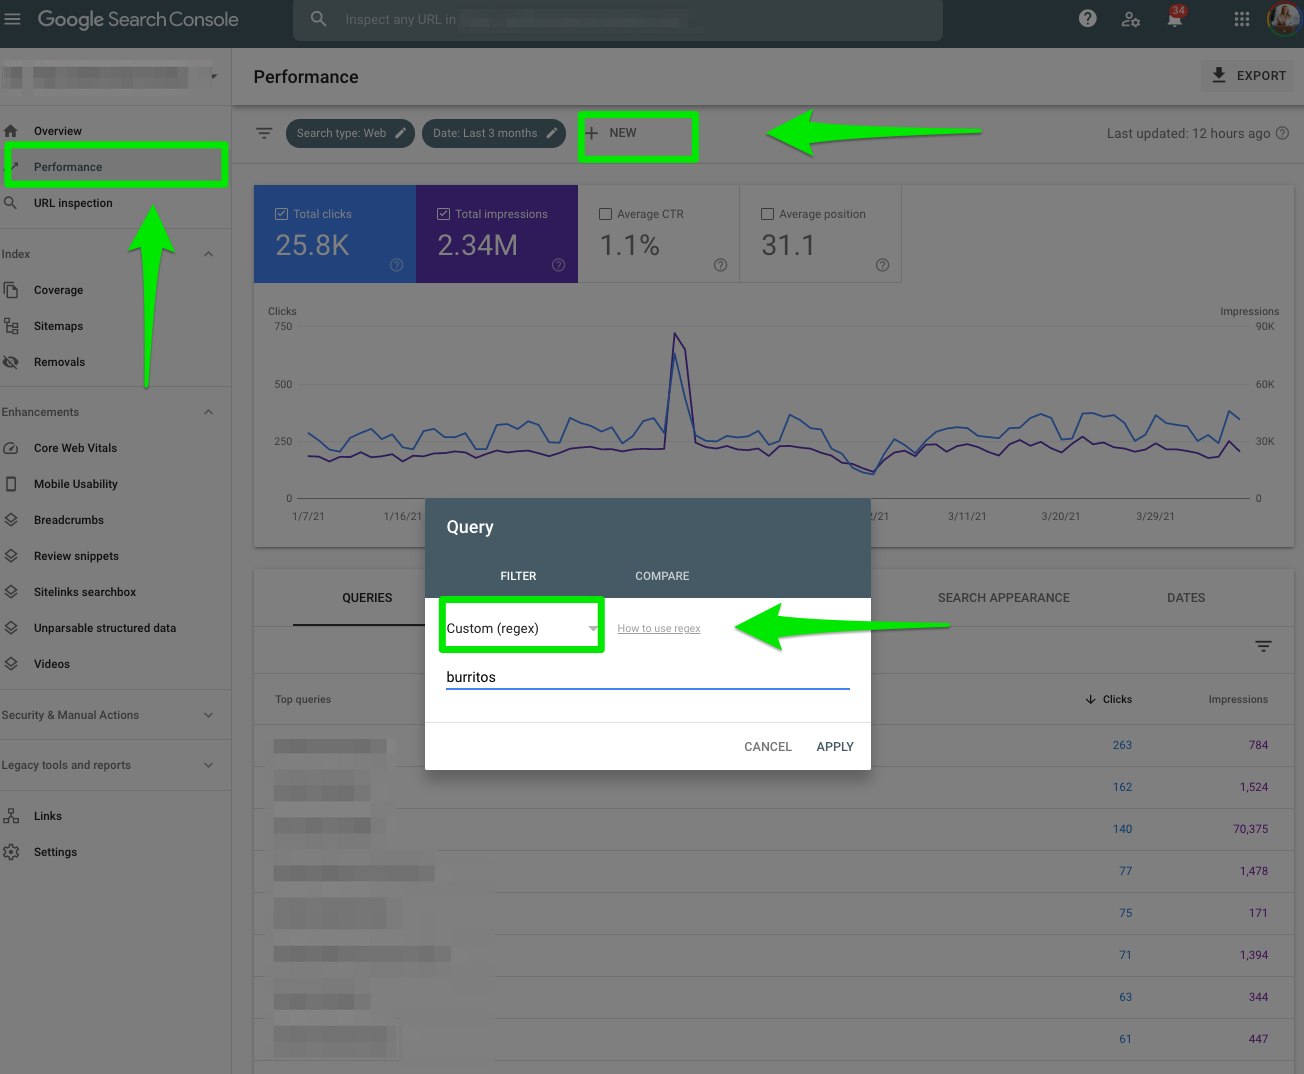

You can also slice and dice the data filtering even further when you’re comparing data so you can see it side-by-side.


Discover
What Is the Discover Report in Google Search Console?
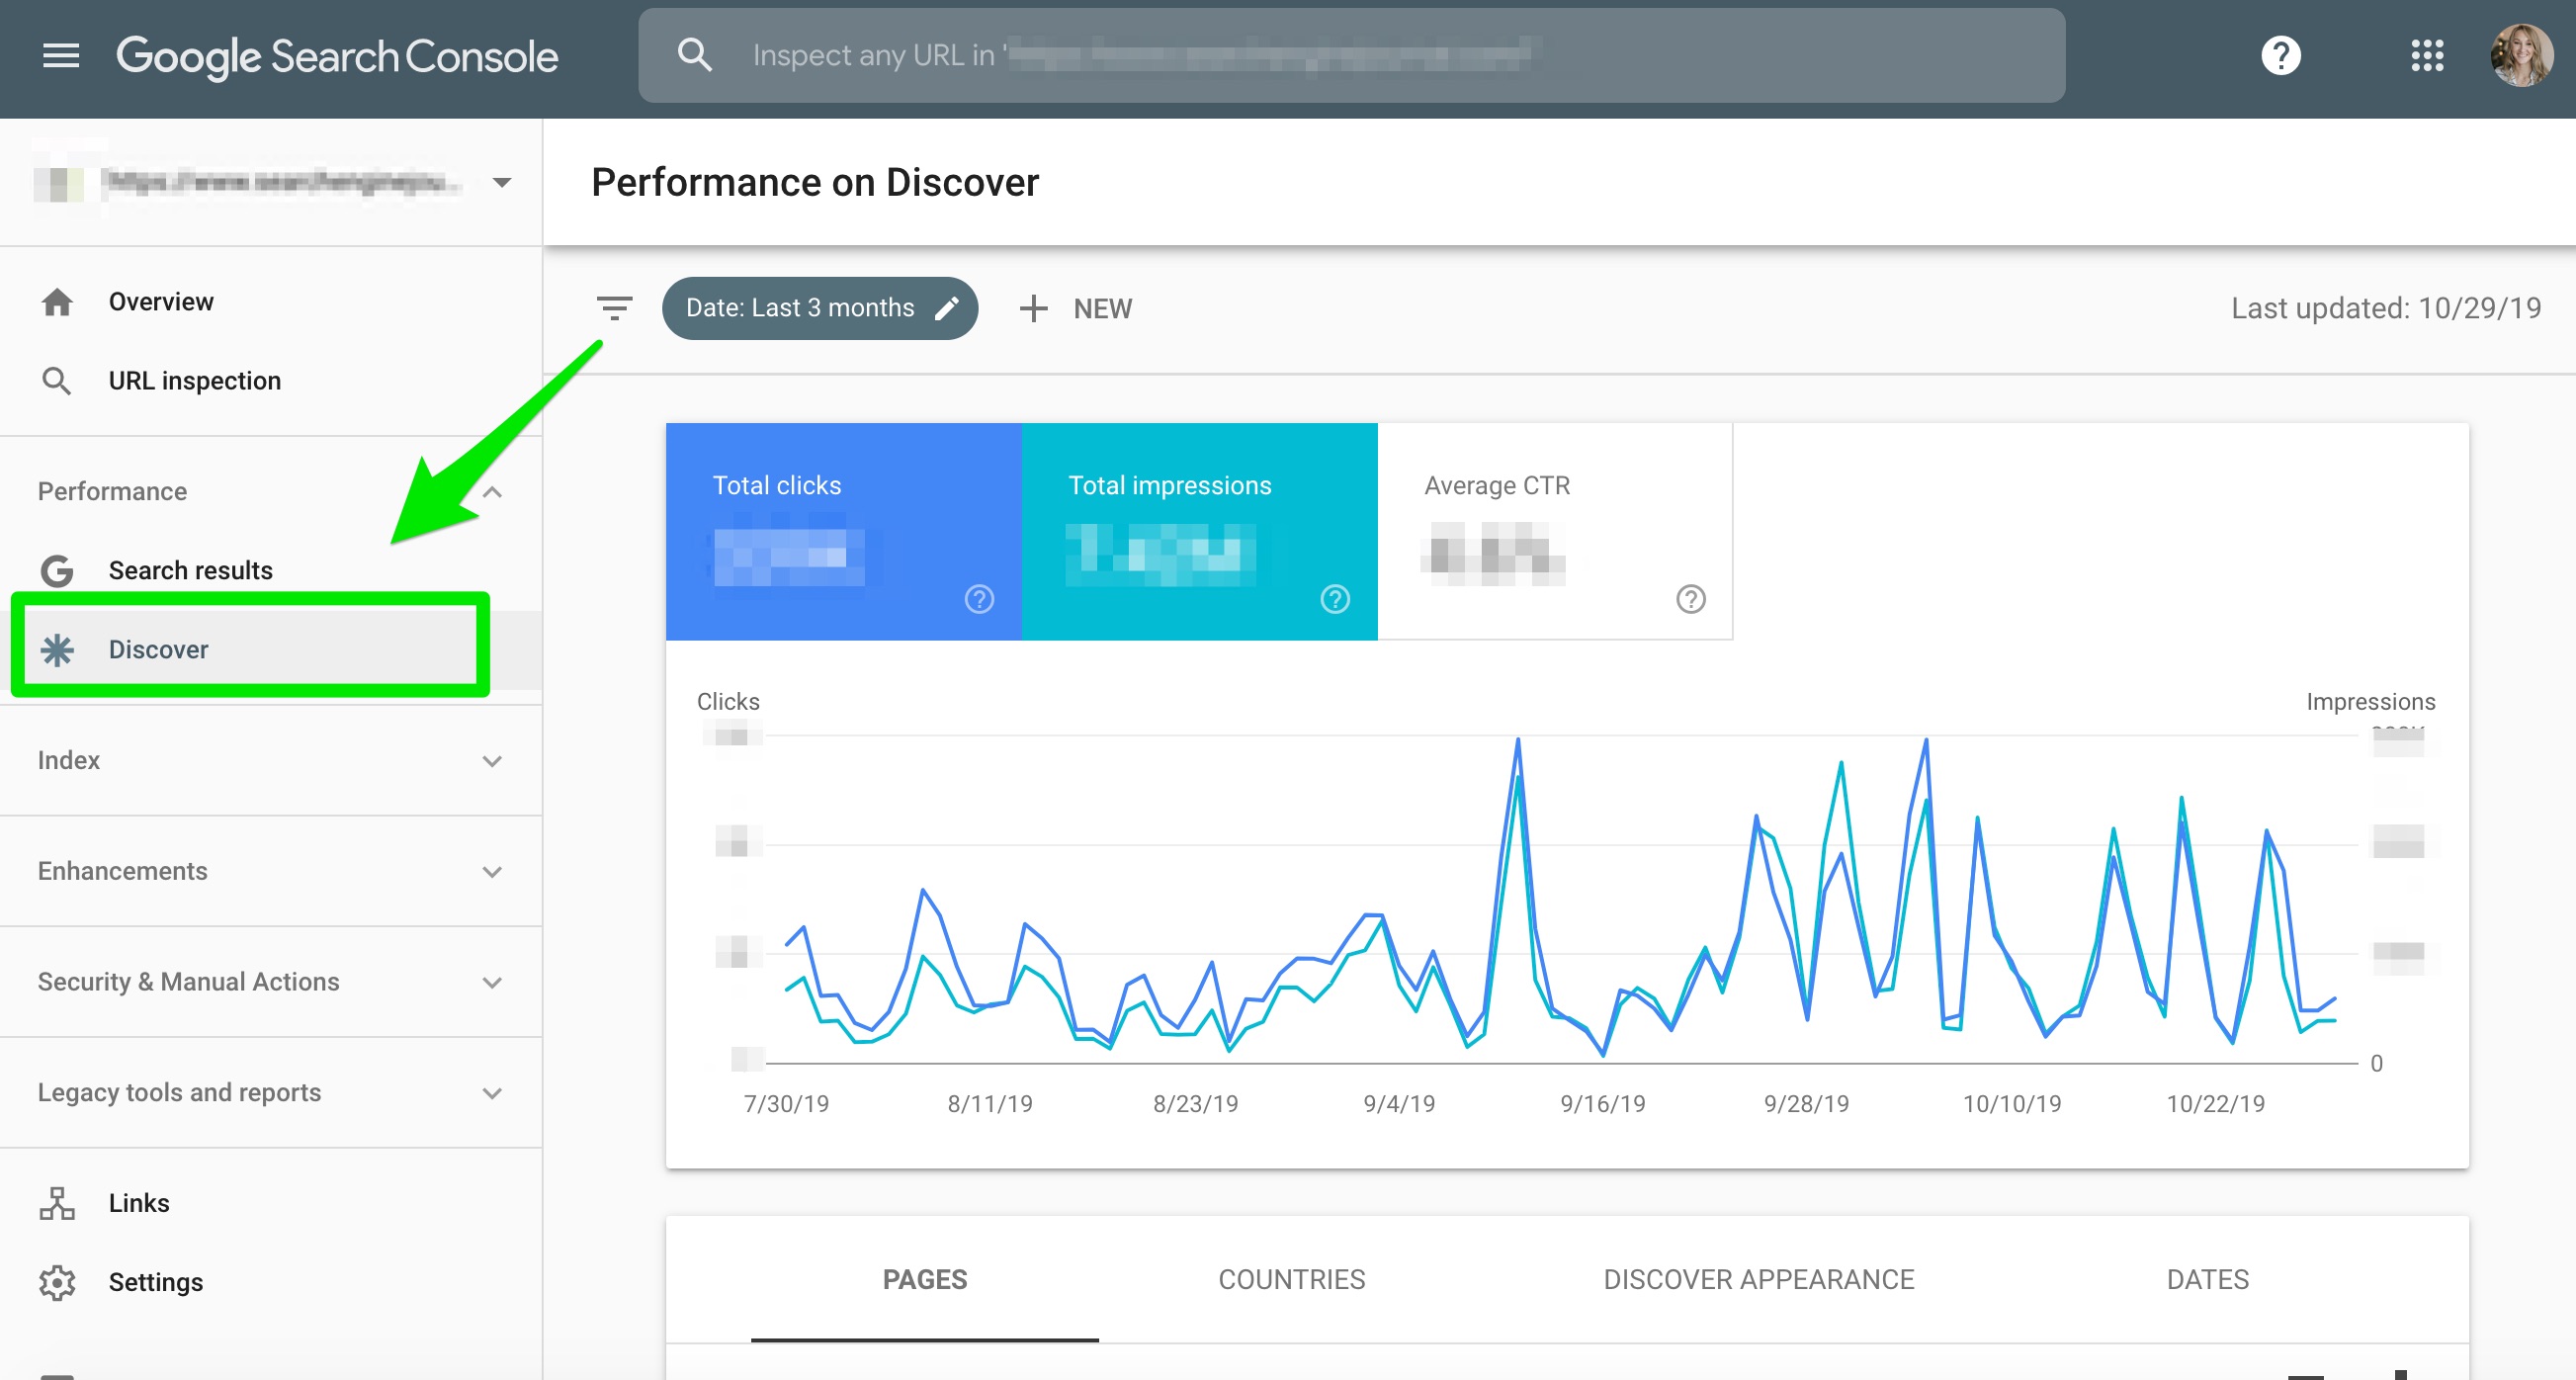
Google introduced the Discover report in April 2019 to give publishers more insight into how searchers are discovering their content.

How to Use the Discover Report
If you’re a publisher, you can use this report to understand how searchers are interacting with your site on Google’s mobile Discover feed and from the Chrome mobile browser.
You can see what types of content perform well, how content is performing compared to other traditional search results, and how often users are visiting your site from Discover.
This report will also include data on AMP stories.
Google News
What Is the Google News Report in Google Search Console?
Google Search Console released the Google News report in January 2021 under the Performance section. The Google News section tracks user behavior on Android, iOS apps, and news.google.com.
How to Use the Google News Report in Google Search Console?
In the Google News report, you can see impressions, clicks, and click-through rate segmented by country, devices, and date.
Matt Southern explains more about how to use the Google News report to improve your content performance.
Index Reports
Whether you’re looking for index bloat, trying to find if CSS is blocked, or remove URLs, the Index reports in Google Search Console can have you spinning in circles.
I’ve battled everything from low organic traffic to Panda hits because of thin content.
The Google Index reports in Google Search Console provide data on how your content is performing in the Google search.
(Note: If you’re looking for the Content Keywords section, it was removed in November 2016.)
Coverage
How to Use the Coverage Report?
In the Google Search Console, the Coverage report also displays all your indexed pages and all the pages that are not included in your sitemap.
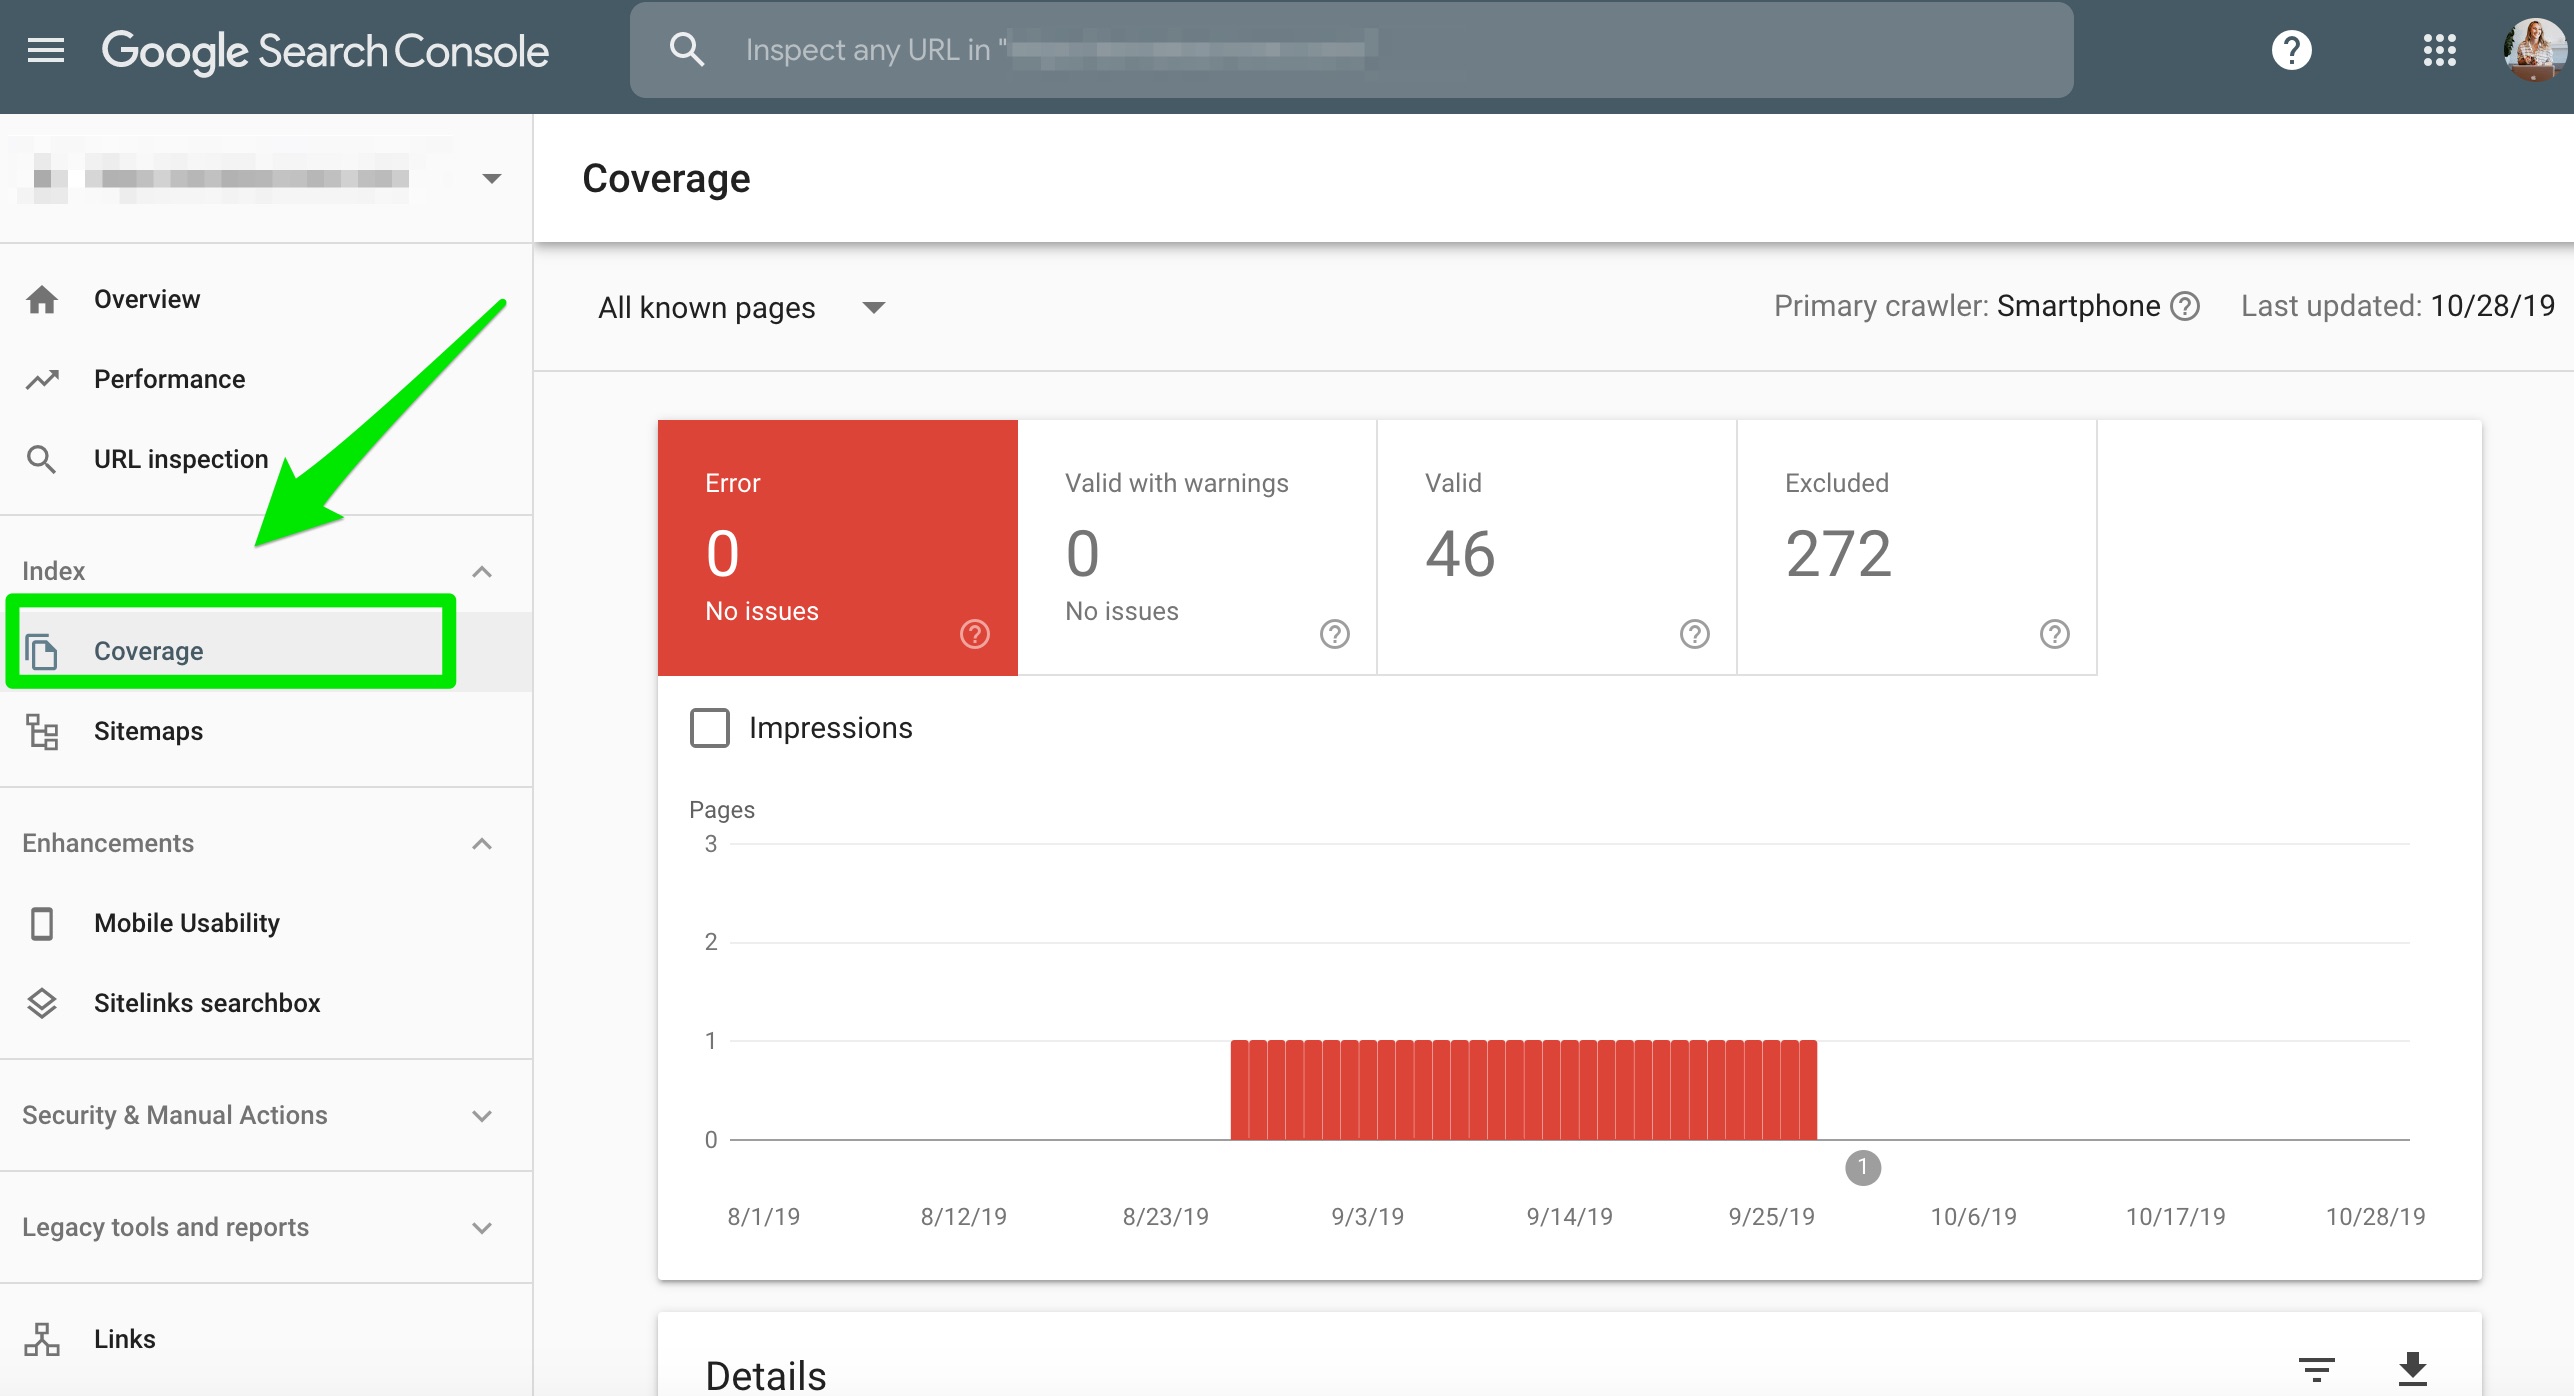

It will provide a list of errors, like this:


The Coverage report is also the Crawl Errors report. It tells you what pages are broken on your website.
You used to see something like this:
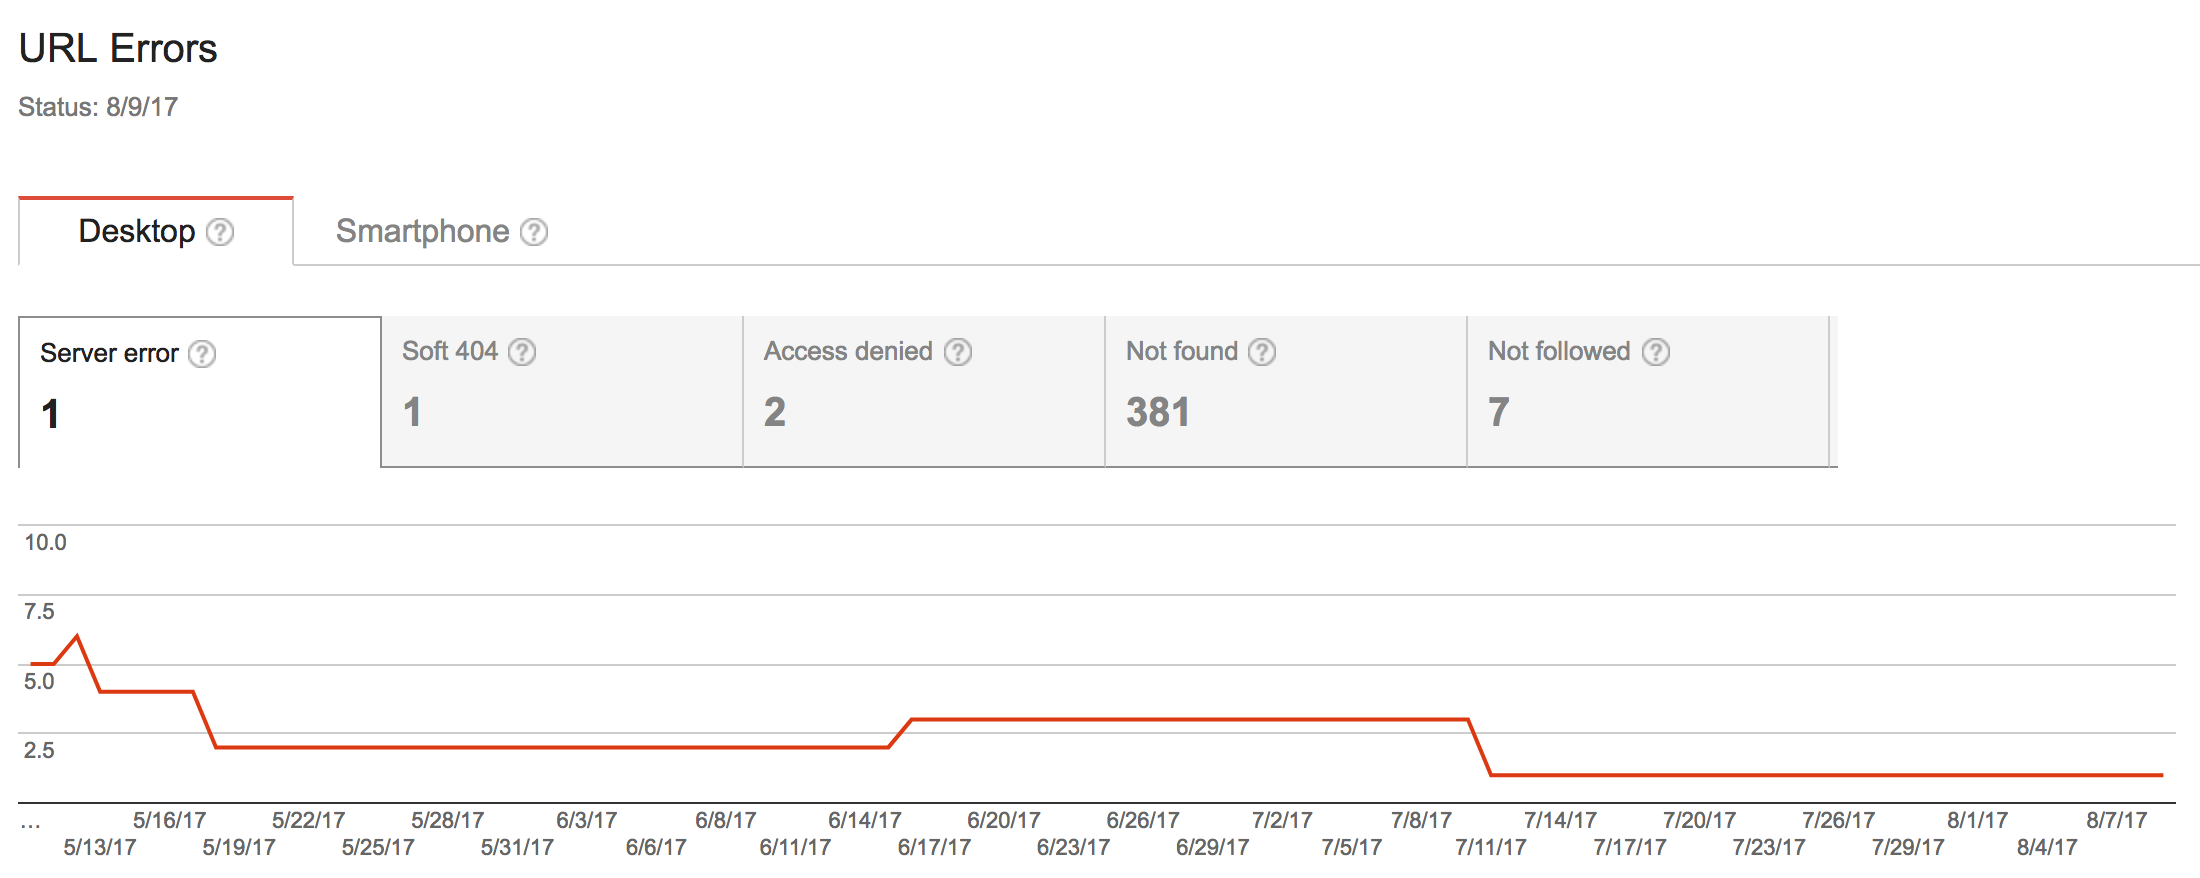

Going forward, you’ll want to monitor this report to make sure there are no large increases or decreases in your indexed pages.
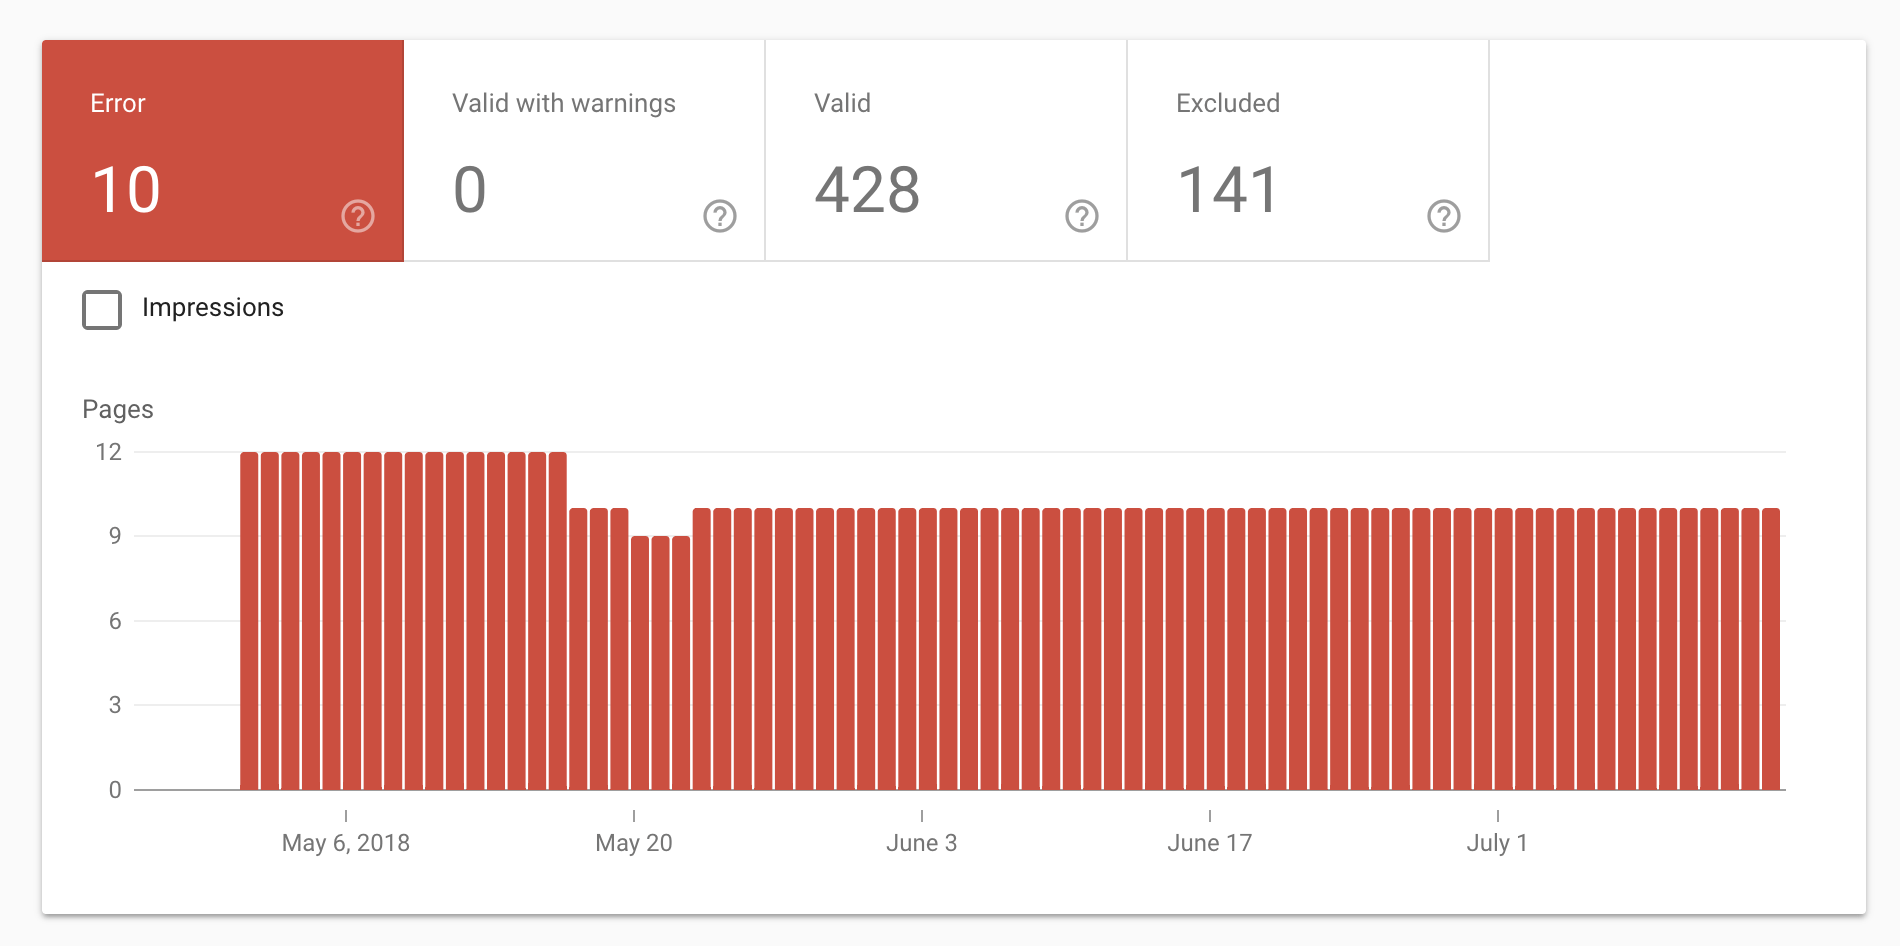
I like to use this report to determine if there is index bloat. By pairing the data from Google Search Console to Google Analytics, webmasters can find out if they are the unfortunate receivers of index bloat.
You want to see if the number of pages in the Coverage Report matches the number of landing pages receiving organic traffic in Google Analytics.
If they don’t match, it most likely means a small fraction of your indexed pages is receiving traffic.
How to Find Index Bloat in Google Search Console?
To find index bloat follow these steps:
Go to the Google Search Console > Index > Coverage. You may see something like this:

Go to Google and perform a site:[insert website url] search


Dig through each page of the search results to find a pattern in the parameters of each page.
If you notice pages being indexed that you don’t want to be indexed, go back through and add the noindex tag to each page and disallow them in the robots.txt file.
How to Fix Crawl Errors?
Some standard Crawl Errors:
- DNS (Domain Name System) error: This error means something is happening on the server-side so contact wherever you’re hosting (GoDaddy, BlueHost, etc.).
- Server errors: Server errors usually happen when you’re site is being hit with too much traffic. You’ll want to dig deeper to see if it’s an issue related to the connection or timeout.
- Soft 404 errors: These errors indicate that your header HTTP response code does not return a 404 code. To fix, implement a 301 redirect if the page is dead or review the page for thin or duplicate content.
- 404 errors: These are the most common error you will get. 404 errors can happen when you unpublish a page, delete the page, etc. While 404 errors don’t impact your rankings necessarily, they can impact your links. If you have 20+ links pointing to a 404 page, you’ll want to 301 redirect that page immediately.
After a long month of page speed enhancements and keyword mapping, the easiest quick fixes you can do to your website are cleaning up your crawl errors.
With just one 301 redirect, you can transform a broken link into a magical nest of backlink unicorns.
Meaning: If you have a broken page that is generating a lot of backlinks, 301 redirecting it will make sure you’re still getting the credit (and authority) for those backlinks.
Sitemaps
What Is the Sitemaps Report?
Sitemaps can feel like the mysterious man hidden behind the green curtain.
So much of what you include in your sitemap, from excluding tags to removing categories, can affect your website.
Pay attention to the Sitemaps report warnings. Here is a look at the Sitemap section.
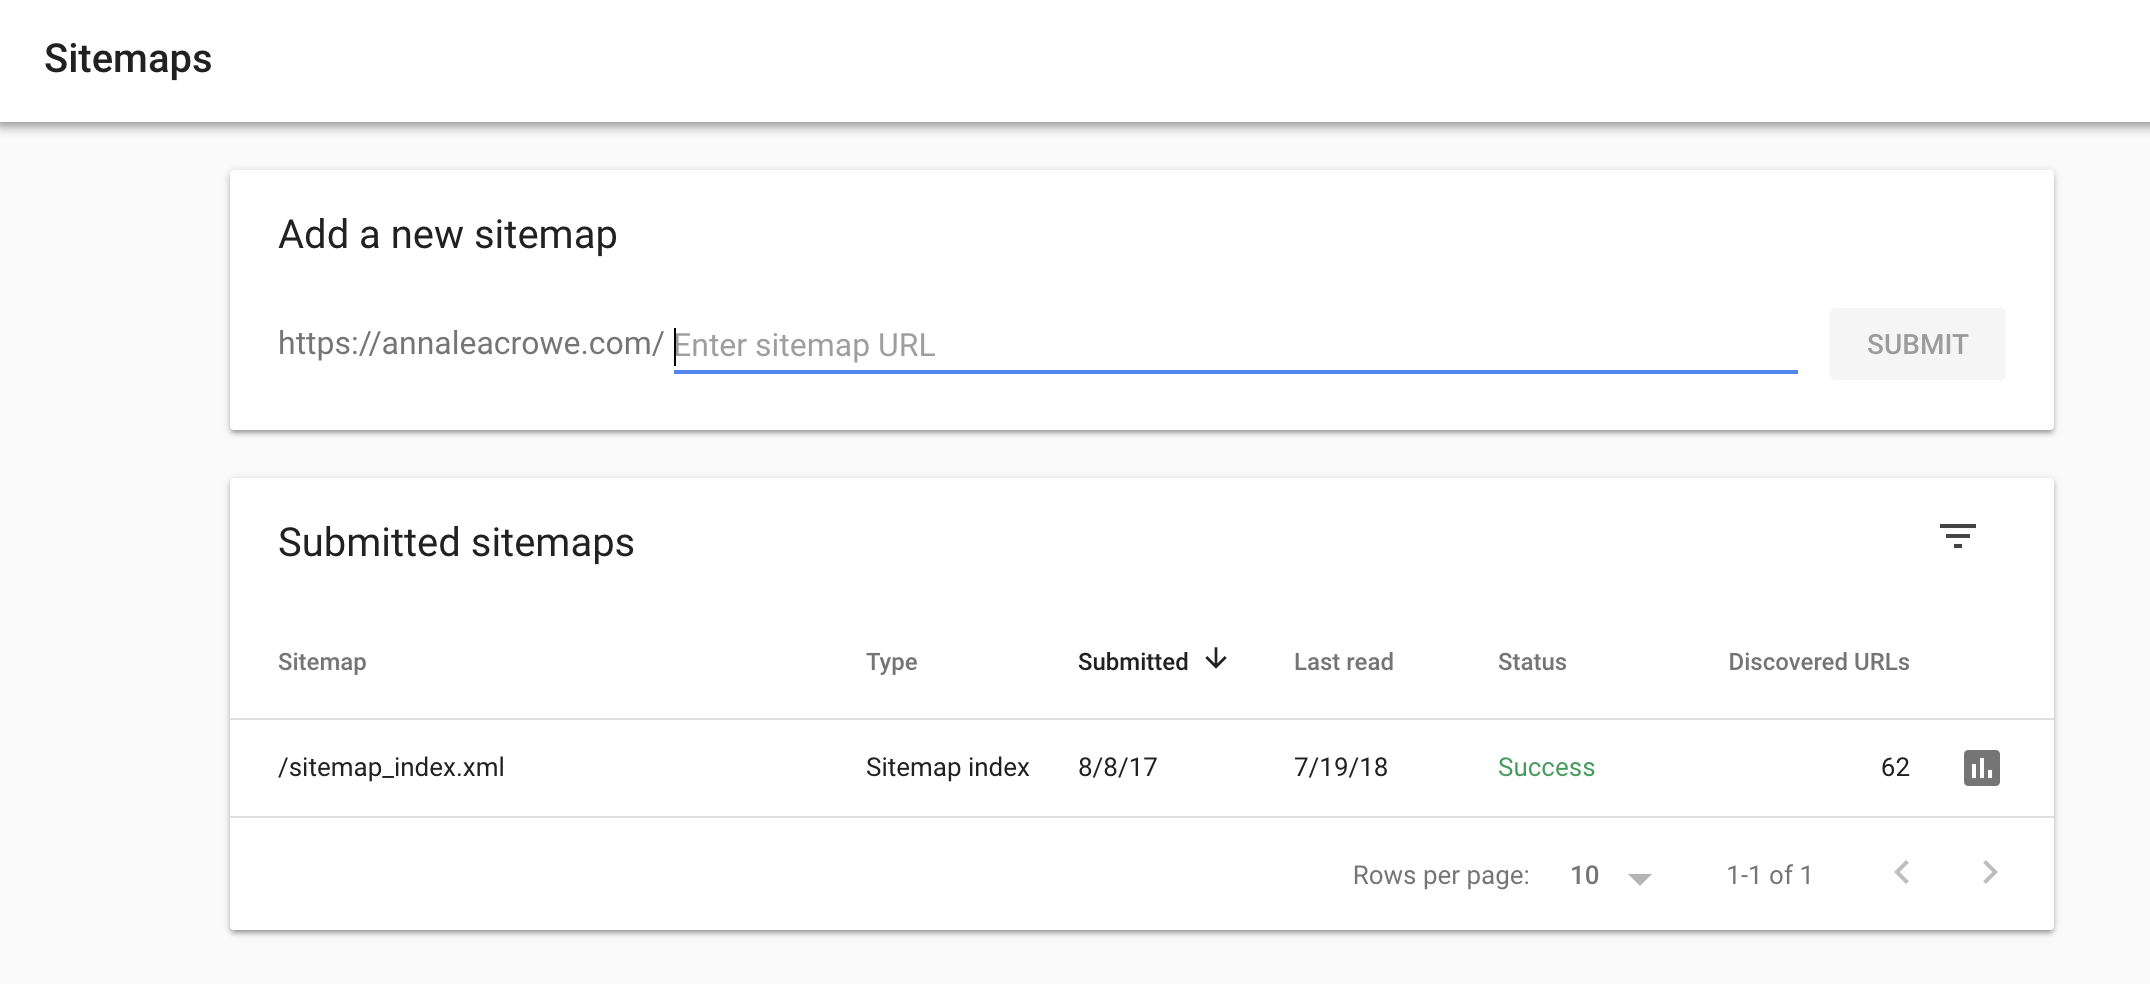

The Sitemaps report in Google Search Console shares insights into what is happening on your website.
Yes, these are errors found in your sitemap, but so much more can be discovered from this error report.
How to Fix Errors in the Sitemap Report?
Fear not, your best defense to these sitemap errors is digging deep into the cause of why these errors occurred in the first place.
Here is a problem I’ve come across through my site audits…
A large website comes to me for an SEO audit. They have 100,000+ pages with multiple sitemaps. Awesome, right?
After taking 5 seconds to review their sitemap errors, I noticed only one URL was being indexed compared to 16,000 URLs from this sitemap.
After more investigating, I saw an uppercase letter in the sitemap entry.
After fixing the entry, 83% of the pages were indexed in two weeks.
Removals
What Is the Removals Tool in Google Search Console?
The Removals section in Google Search Console can be, in a word, complicated. It’s a universal truth that at some point every SEO professional will have a client suffering due to thin or duplicate content.
The Removals section is broken down into three areas.


Temporary Removals
If you want to temporarily hide something from Google searches (like massive amounts of thin or duplicate content),) you can add the URL to the Removals section in Google Search Console.
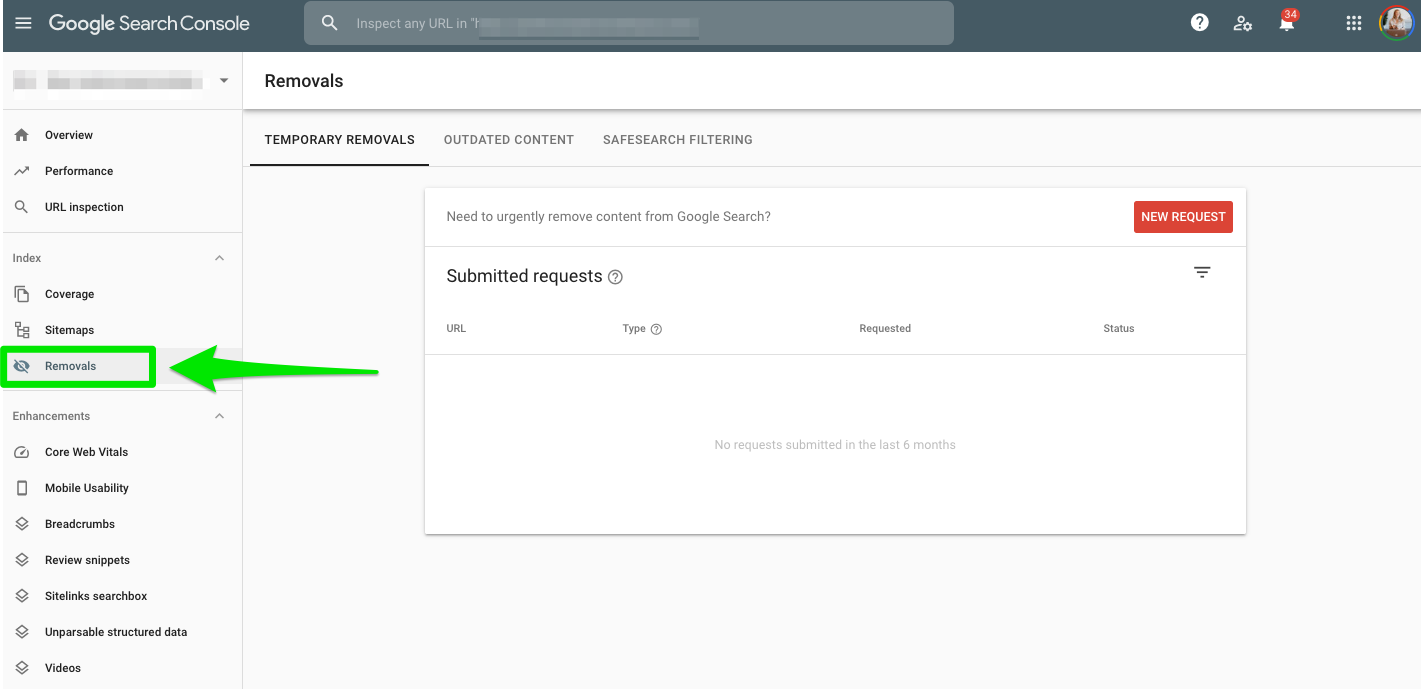

This temporary removal will hold for six months, and it takes about a day to process.
You’ll still want to block the URL at some point in the robots.txt or with a 404.
You can also use the Removals section in Google Search Console to clear the cache URL to completely remove the page description snippet. It won’t reflect until the page is crawled again.
Google dives into how you can hide content using the Removals section, as well.
Outdated Content
In the Outdated Content section, you can view the removal requests sent by the public. So, any person can suggest an update to your search results if the correct information is not available.
You can view this data over the past six months.
SafeSearch Filtering
In the SafeSearch Filtering section, you can see what content is reported as adult content using the SafeSearch suggestion tool.
How to Use the Removals Section?
In the past, I’ve used this tool to not only quickly clean up thin or duplicate content before Panda comes rolling in, but to spruce up URLs with multiple case-sensitive issues, as well.
Here’s an example:
annaleacrowe.com/meet-anna
annaleacrowe.com/Meet-Anna
www.annaleacrowe.com/meet-anna
Before submitting pages to GSC to remove, follow these steps:
- Add noindex meta tag to each page
- Insert the rel=canonical tag to each page
- Disallow the pages in the robots.txt file
- Submit to Remove URLs
Think of this tool as a secret weapon to call out of retirement only when needed.
Enhancements
As an SEO pro, you can use the Enhancements section in Google Search Console to do a lot.
You want it to tell you the secrets to getting your structured data working and if your AMP pages are active. You love it when they say you have no error codes.
Just tap the Enhancements tab in the left menu bar to view all the reports and tools. Let the nerding out begin!
Core Web Vitals
What Is the Core Web Vitals Report?
In May 2020, Google rolled out a Core Web Vitals report in Google Search Console.
The Core Web Vitals report is meant to show you the quality of the experience a user has on your site.
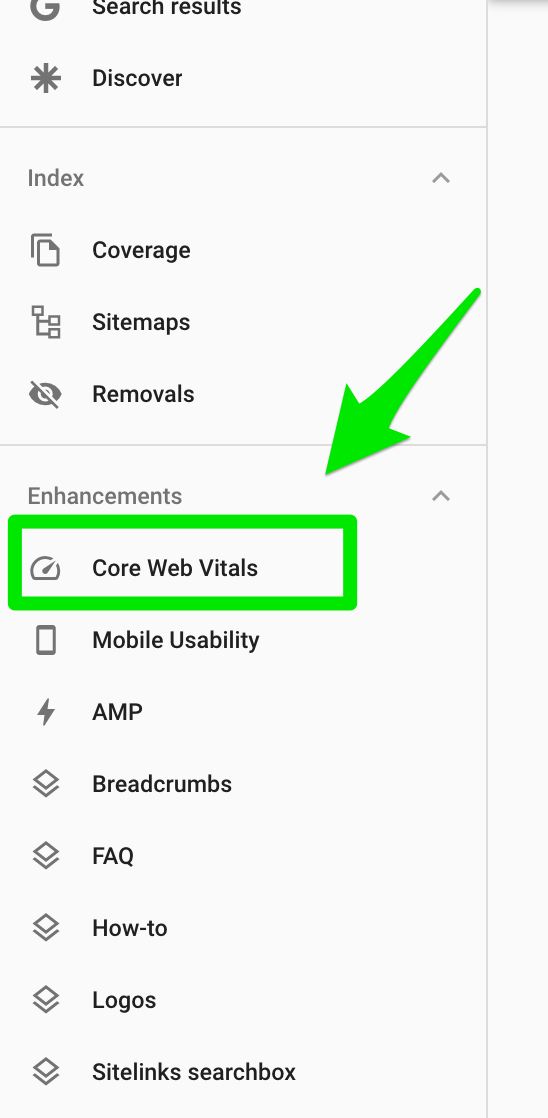

The report is broken down by mobile and desktop.
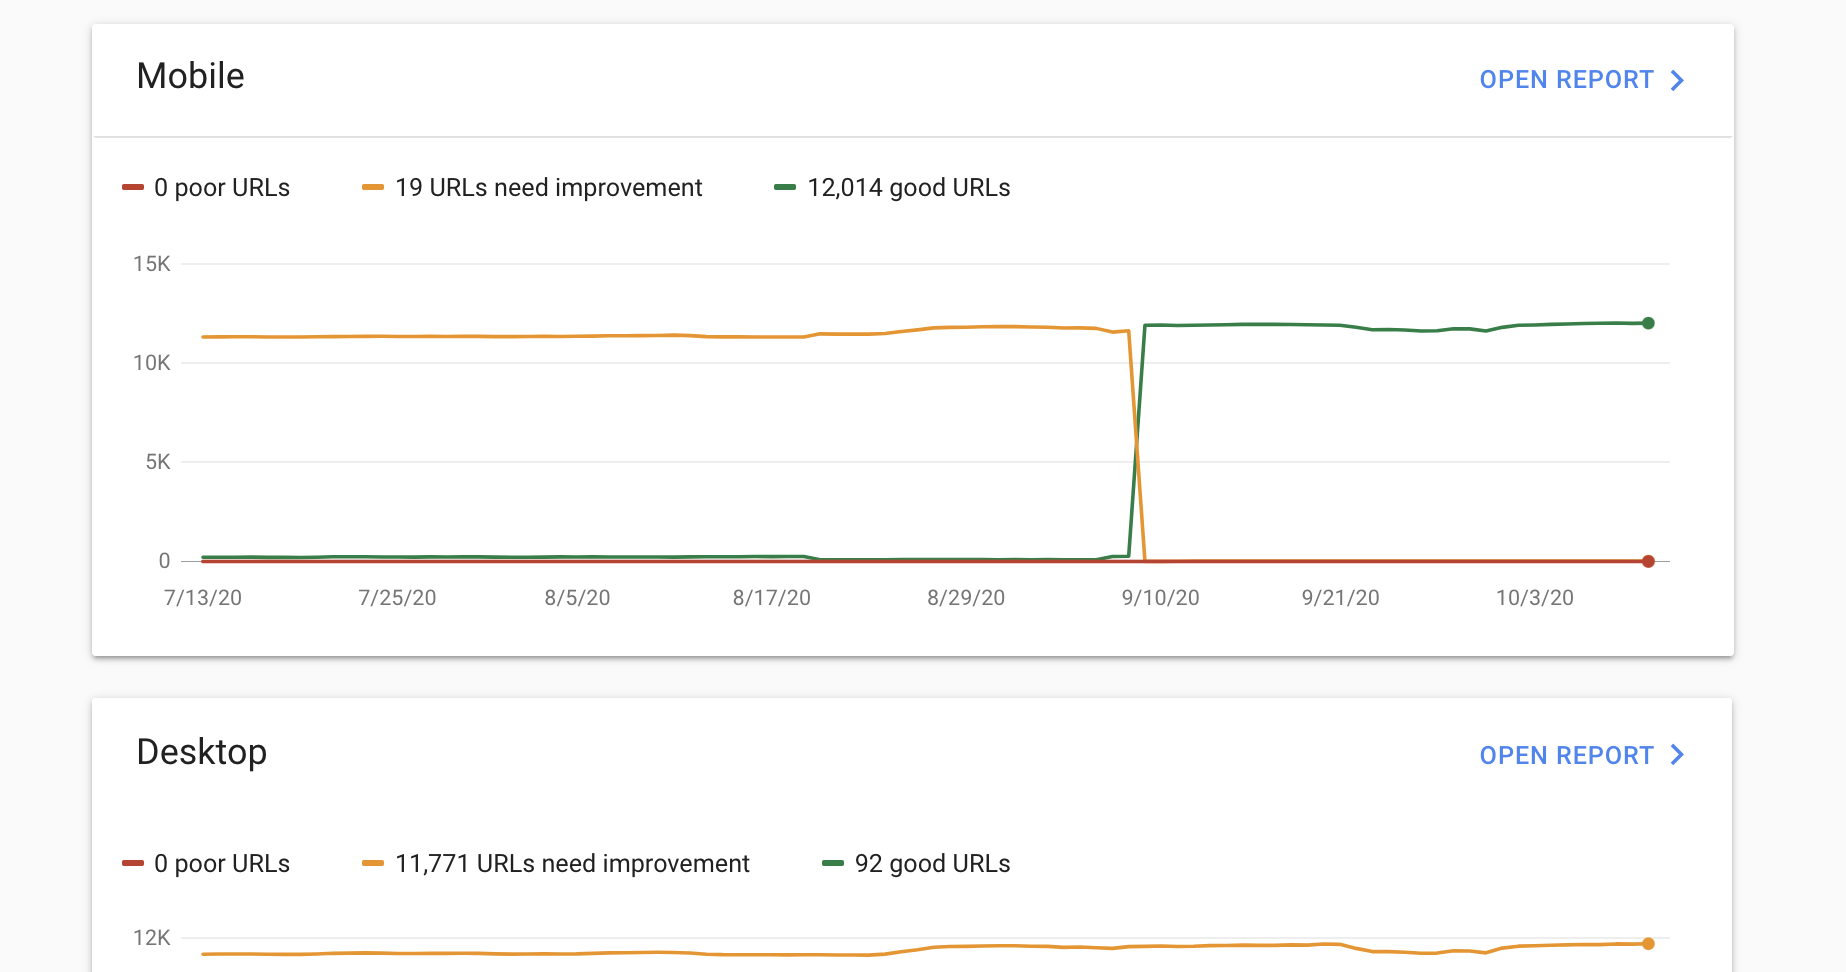

The Core Web Vital report in Google Search Console is segmented by largest contentful paint (LCP), first input delay (FID), and cumulative layout shift (CLS).
Your URLs listed under “good” meet the threshold for Google.
How to Use Core Web Vitals Report in Google Search Console
If you have URLs listed as Poor, you’ll want to tackle those first. When the issue is fixed, you can resubmit within Google Search Console to see if Google accepted the fix.
When viewing this report, you can start to see how Google is shifting its view on users.
Google is becoming more user-centric, so when Core Ranking Vitals become a ranking signal in May 2021, this report will become even more valuable.
Marie Haynes discusses this Page Experience connection with Core Vitals in a detailed article here.
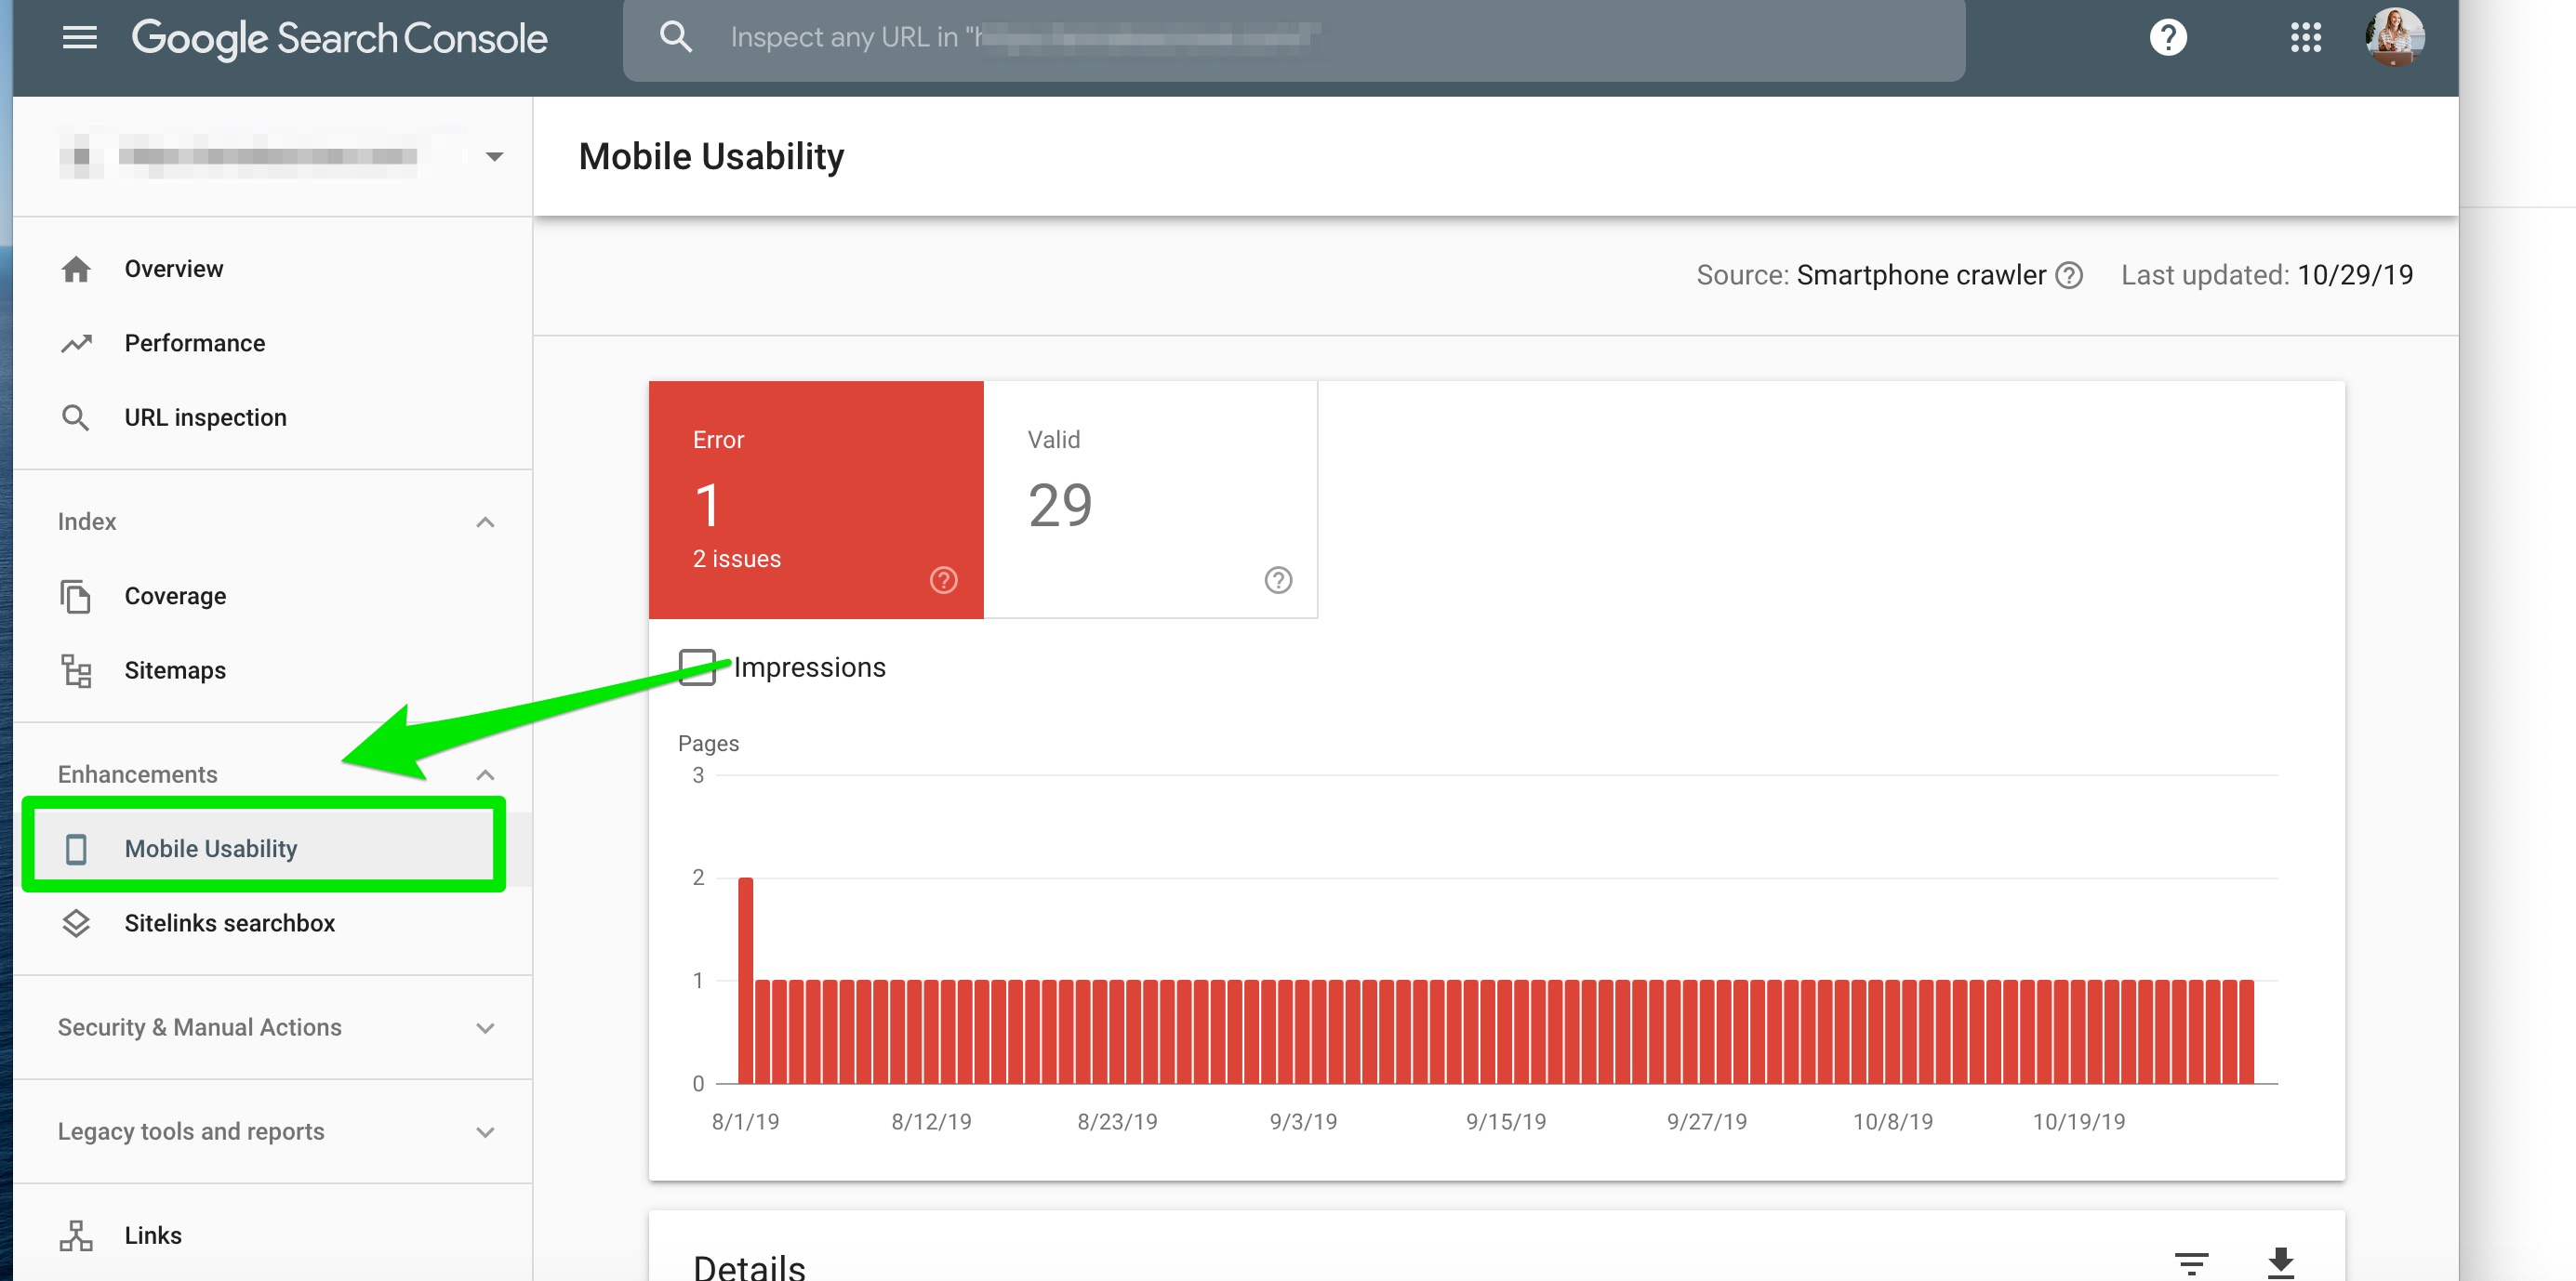
Mobile Usability
What Is the Mobile Usability Report?
Google launched the Mobile Usability report in Google Search Console right before the big announcement of moving to a mobile-first index.
The Mobile Usability report gives you the opportunity to troubleshoot any design and development issues with mobile.
How Do I Fix Mobile Usability Report Issues?
What starts as a well-thought web design strategy can quickly turn into a slow, unclickable, awkwardly scrolling mess of a website, sending you into a whirlwind of zero leads and increased bounce rate.
The side effects of a poorly designed mobile website can leave you drowning in low organic traffic and no customers.
Here are some common errors in the Mobile Usability report and how to fix them:
- Content wider than the screen: Make sure your pages don’t require horizontal scrolling to view entirely.
- Clickable elements too close together: Make sure your links and buttons are far enough apart.
- Viewport not configured: Make sure your pages use the meta viewport tag to adjust the dimensions based on the device used by visitors.

Accelerated Mobile Pages
What Is the AMP Report?
Whenever I have the opportunity to increase page speed with one stone, I take it.
And, it turns out AMP pages are like little SEO burritos 🌯🌯🌯, with all of the mobile search result benefits I’m loving bundled into one easy-to-implement tactic.
Increases page load time? Boosts in mobile ranking? Improves server performance? Check, check, check.
Recently, Google announced that Google Search Console will now track images that interacted with the ‘swipe to visit’ feature. You can see this feature in the Performance reports above.
So when you’re ready to check for any errors in your AMP markup, the AMP report in Google Search Console is your best friend.
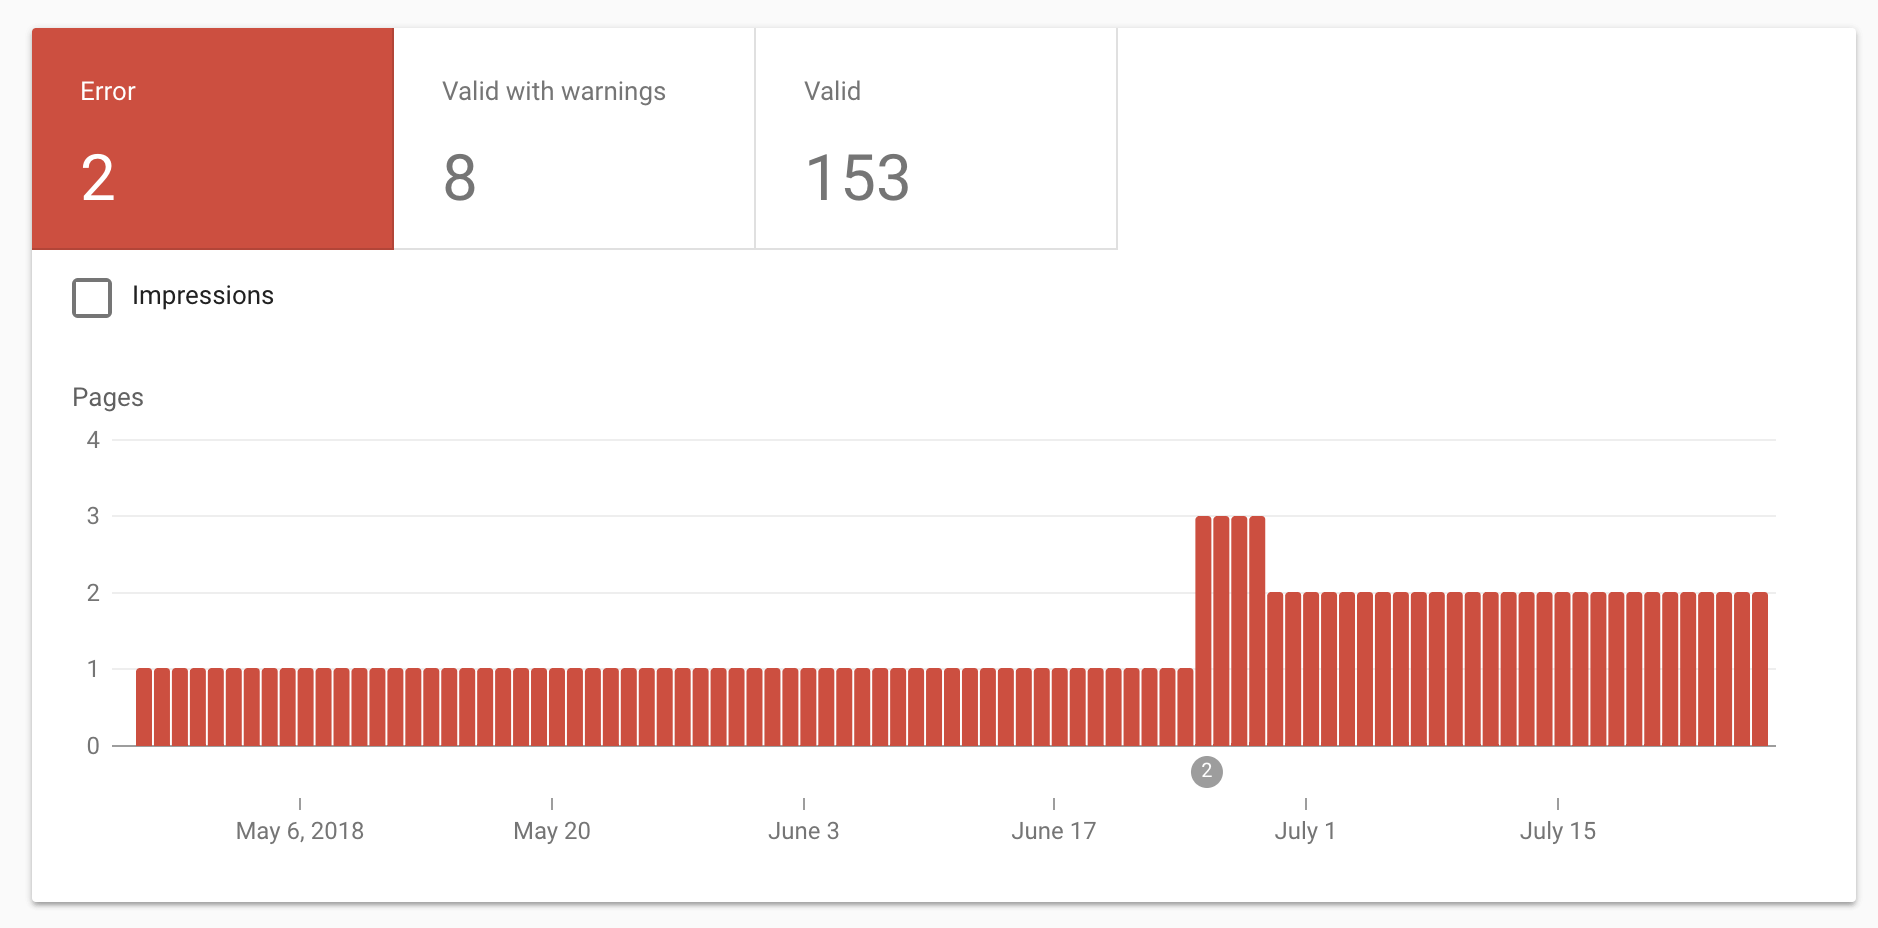
Here is a look at the AMP report in Google Search Console.

How Do I Use the AMP Report?
The AMP report in Google Search Console allows you to monitor your AMP pages.
You can watch for site templating and any other implementation issues that affect your AMP pages. You can also the AMP Test Tool if you’re making any big changes.
If you’re using rich results, you’ll also see issues with your AMP pages listed in that section.
And, as we mentioned above, you can filter AMP results in the Performance report. Pretty cool, huh?
And, Google has been notifying site owners about issues related to their AMP report.
Breadcrumbs
What Do Breadcrumbs in Google Search Console Tell Us?
The Breadcrumbs report in Google Search Console was rolled out in September 2019.
This Breadcrumbs report helps website owners fix any issues that may be preventing breadcrumbs from displaying in the SERPs.
And, any website owner can understand the woes of implementing structured data. You add the code to your site, but it’s still not showing in the SERPs.
Luckily, Google has done all the hard work for us.
After you’ve added the code to your website, pop into Google Search Console > Enhancements > Breadcrumbs to check for errors.
The report will include all the breadcrumb structured data errors and how many URLs are affected.
In the Google Search Console dashboard, this is what you will see:


How Do I Fix Breadcrumbs in Google Search Console?
No matter what breadcrumb structured data you’ve used (local business, blog posts, author, organization, etc.), there’s something in this report for you.
Breadcrumb structured data marks up your pages to tell search engines what information to display to your users.
It’s the hierarchy within your site.
This Breadcrumb report will tell you what to check if they aren’t displaying in the SERPs.
Breadcrumbs on your site have proven to help improve organic traffic.
Even though structured data isn’t a ranking factor and your site won’t lose rankings if you leave these errors, it is better for the user experience if you fix these errors.
To fix the breadcrumb structured data in Google Search Console, you’ll want to analyze each error individually.
I dive more into breadcrumbs and how to fix them in this article.
Rich Results
What Are Rich Results in Google Search Console?
When was the last time you searched for [bourbon maple jam recipe] on your smartphone? Or scanned Google search results for movie times?
There is a time and place for rich results in the SERPs – if you’re a recipe, course, movie (television not reported), or job.
And, if you’re the kind of SEO professional who likes to track errors and performance of your hard-earned rich results, then Google Search Console is the place to go.
The report will show you how many rich results are indexed and if there are any critical errors.
The rich results report in Google Search Console reports more structured data like product markup, sitelink searchbox markup, and unparsable types.
This rich result report is under the Breadcrumbs report.
How Do I Get Rich Results to Show up in Google Search Console?
Now, you can’t create rich results for everything – recipes, courses, movies, and jobs are only fair game for now.
Rich results in Google Search Console use schema data to display content in a more engaging format, which can improve the mobile experience.
The rich results report monitors rich snippets, schema, AMP, and App Indexing.
The rich results will also segment into separate reports depending on the types of structured markup you’re using.
The job posting report allowing you to markup different properties like Education, Experience, ExperienceInPlaceOfEducation, baseSalary, and more.
For the full documentation of the job posting report, reference this guide.
There is also an FAQ and Q&A report that Google uses to check the validation of the FAQ and Q&A structured data.
Once you’ve created your rich results, you can use this report to see what cards are being indexed and if there are any errors.
And, you can use the URL inspection tool.
If you see errors in Google Search Console, most likely your rich results are not being displayed in the SERPs.
Review Snippets
What Is the Review Snippets Report in Google Search Console?
The Review Snippets in Google Search Console can be found under Enhancements.
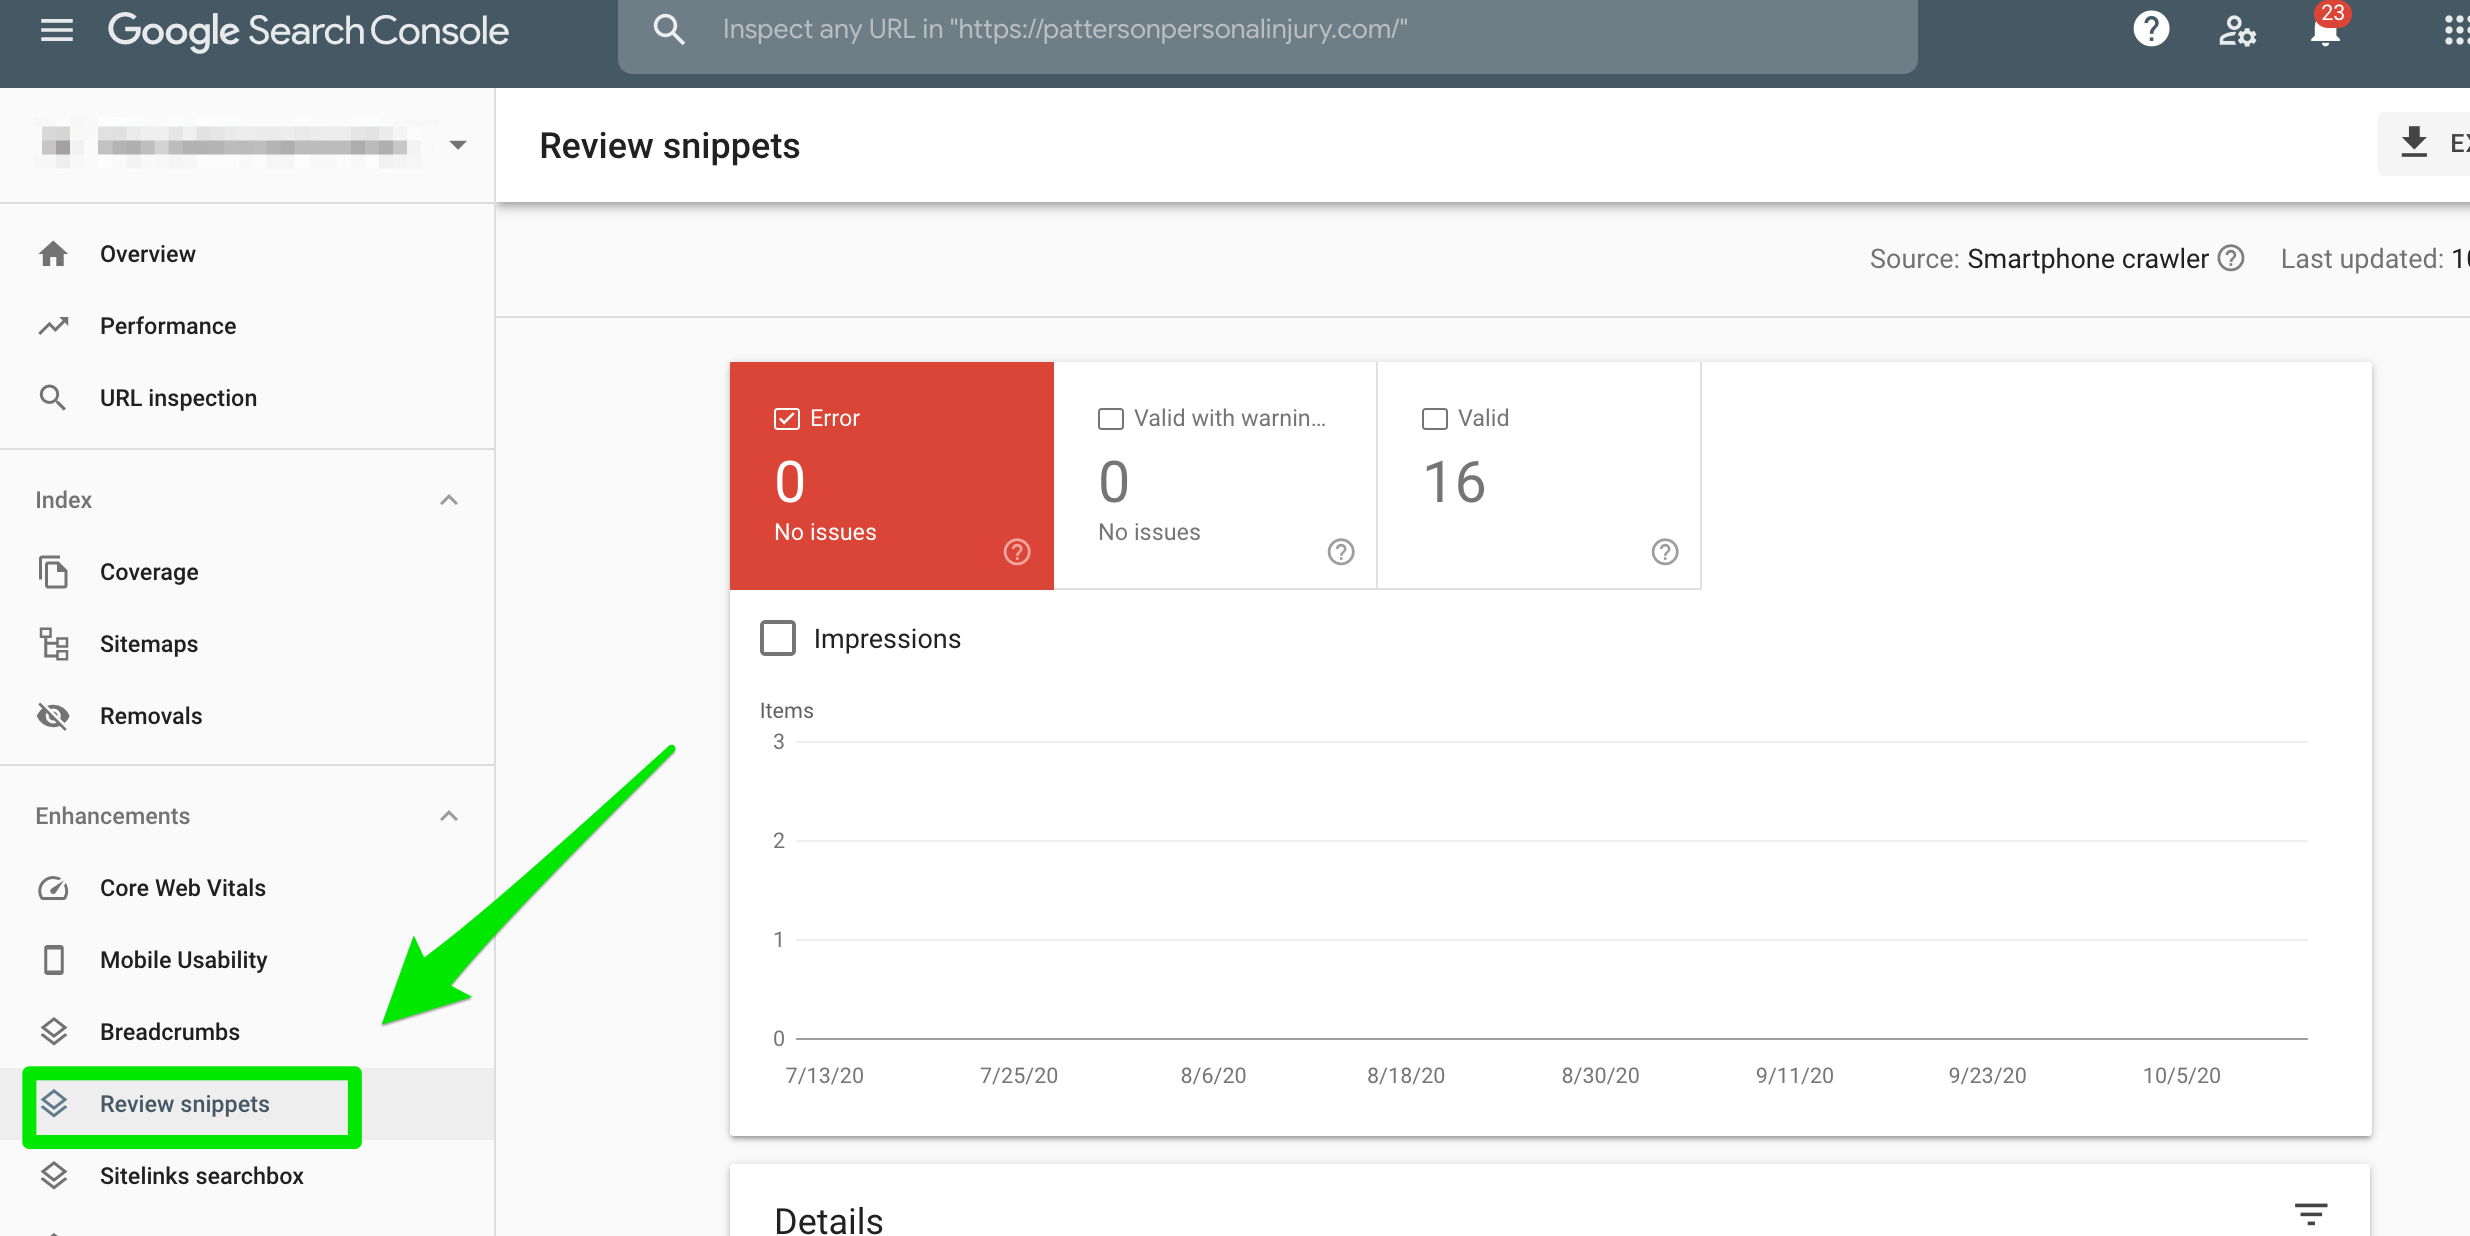

If you’re marking up your reviews using schema, this is the report that will explain whether they are implemented correctly.
How Do I Use the Review Snippet Report?
The Review Snippet report will show you how the pages are performing, ensuring the snippets are activating, and more. You can read more about this in the official report here.
Logos
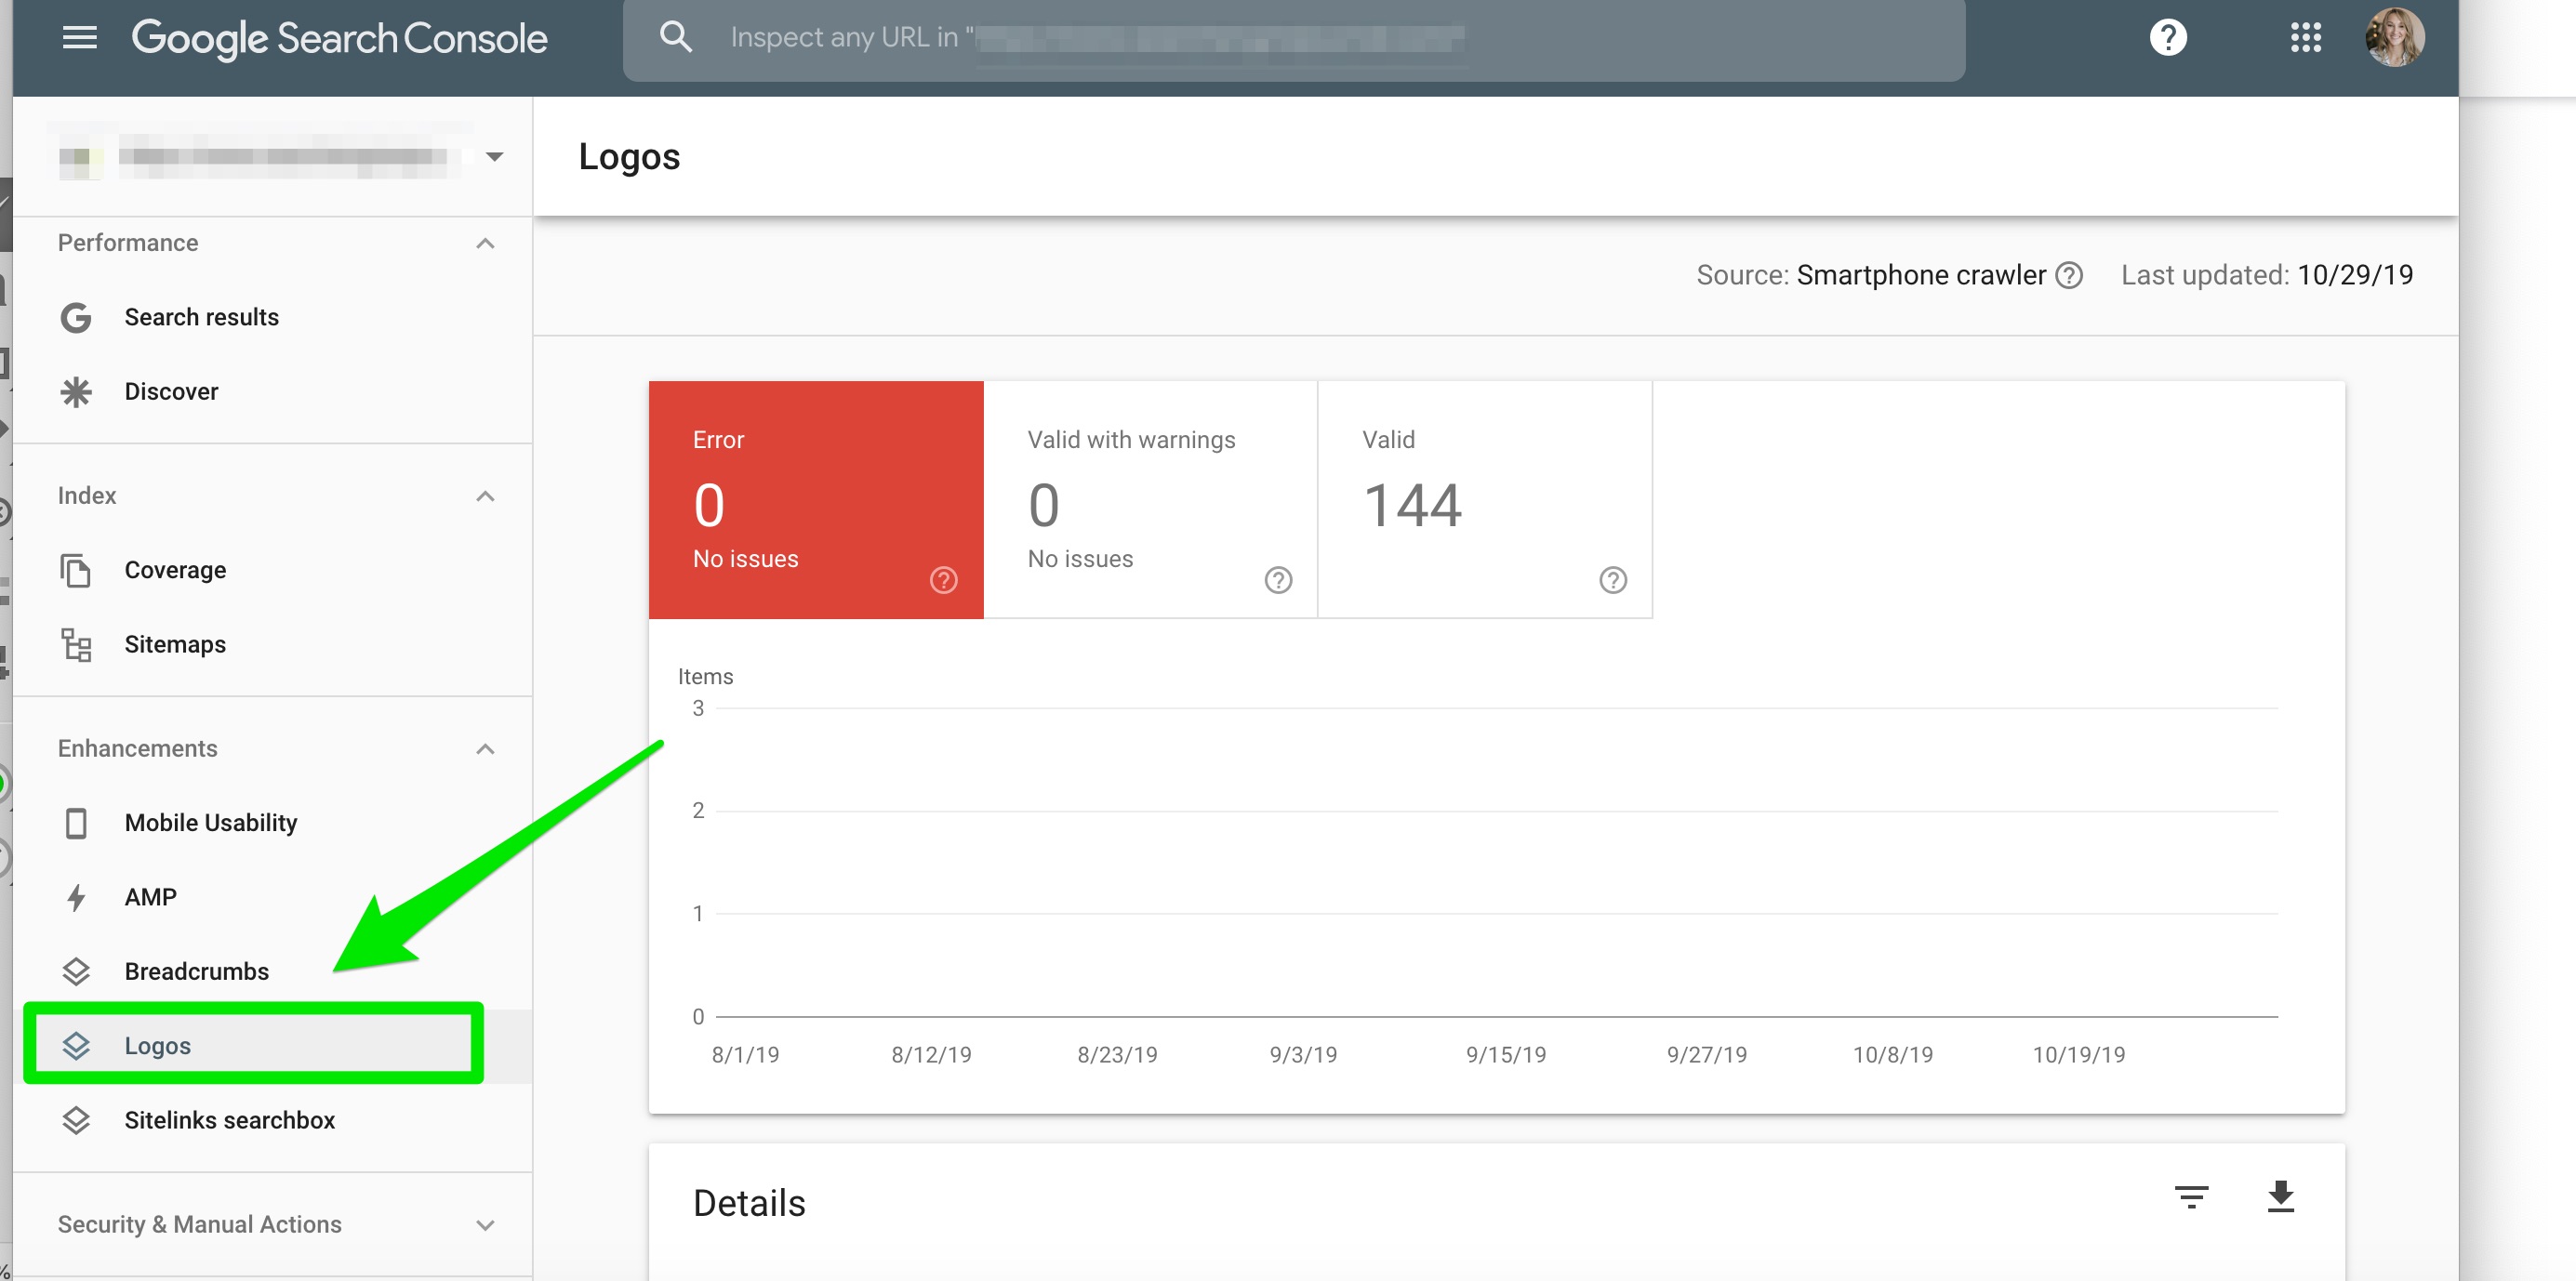
What Is the Logos Report in Google Search Console?
If you’re using logo markup, this Logo enhancement report will show you the performance and errors associated with that markup.

How Do I Fix Logo Report Issues?
Sorry, the comment form is closed at this time.